
Contents
Introduction
| Applies to: | |||
|---|---|---|---|
| ✔ Dynamic | Mobile | ✔ Client Portal | |
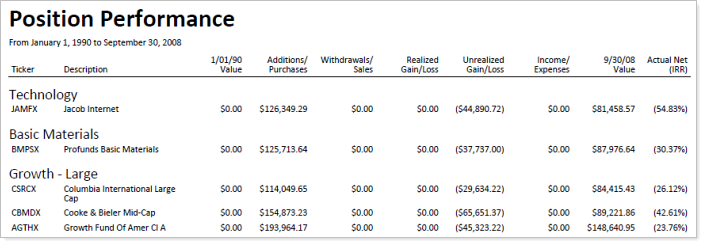
The Position Performance report aggregates performance, holdings, and transactions data to provide details about how an account or group achieved the reported returns. On the report, you can see a granular breakdown of returns for specific securities alongside transaction data like inflows and outflows, income and expenses, and change in value of securities held and sold.
The Position Performance report is often used in conjunction with the Account Performance report to see the impact of individual securities within the larger context of overall portfolio performance.
In PDF reports, lines that do not include data will be dropped from tables if you're using the enhanced performance calculations.
Why Use the Position Performance Report?
In the Position Performance report, you will find versatile sorting and grouping options that let you answer detailed questions about holdings and returns, such as:
-
which positions experienced the most growth from market value in this account?When returns and changes aren't equal, use this report to see the capital appreciation for each position.
-
How did all the securities I categorized as "income" perform?Evaluate returns for specific positions within an account or group.
-
Can I show clients more Detail than the Summary Report?For clients interested in diving deep into their financial details, use the Position Performance report to provide as much detail on returns and impact of specific positions on performance.
-
How are individual positions contributing to performance?Use Contribution and Average Weight columns to see attribution reporting and see which positions contributed the most and least.
See the Position Performance Report in Action
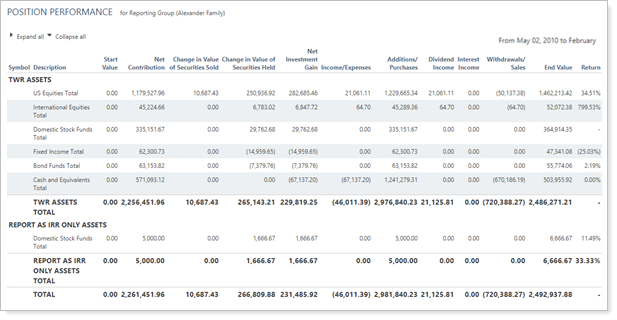
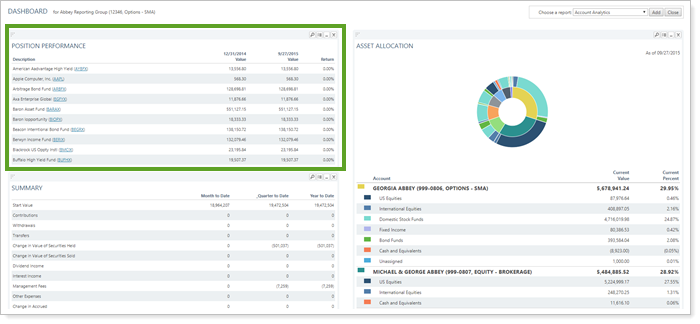
An advisor is interested in seeing flows and returns for an account at the position level. The Position Performance report allows the advisor to see flow-related columns alongside income sources like dividends and interest, returns, and value for each position within an account. This position-level view of flows and returns provides detail to help understand the impact of certain positions on performance.
Features of the Position Performance Report
The Position Performance report helps you easily filter and sort data to drill down to meaningful results. Interactive reporting features include the following.
This report displays managed, unmanaged, and total account value, flows, returns and more data points from the Summary report. For details and considerations about these data points, see Summary Report Data Point Calculations.
Customize the Data and Report Display
Display only relevant data. Select specific columns to display and for the selected date period. You control what data are displayed and which columns are included, in what order, so you can create the exact report you need.
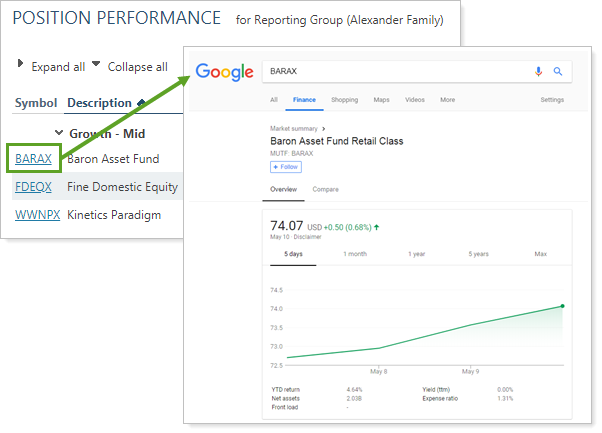
View Security Details
Click the name of a security to view Google Finance information about that security.
You can enable or disable ticker links for each security type.
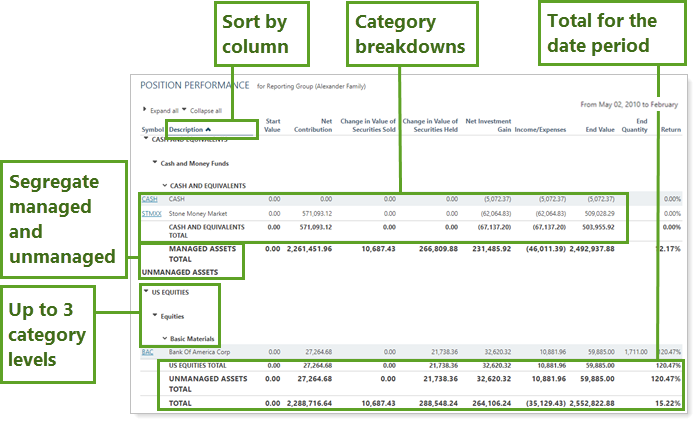
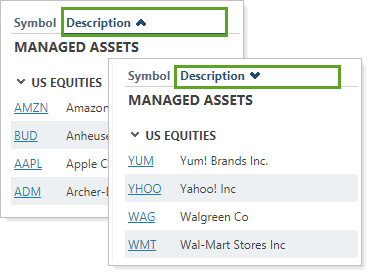
Sort Columns on the Fly
Sort columns by clicking column headers. The caret direction (^ or ˅) indicates sorting order, either ascending or descending.
Show Managed and Unmanaged Assets
Display managed, unmanaged, and total asset summary statistics side by side.
You may notice that total flows don't always match the sum of managed and unmanaged flows in some reports. This occurs when, for performance purposes, there is a flow between managed and unmanaged. When viewing the total, this flow is not needed for performance purposes and so is excluded from these aggregated numbers.
Because of this, the following flow columns may not sum to total:
|
|
For more information about marking securities as unmanaged and how reports display unmanaged assets, see:
- How Reports Handle Unmanaged Assets
- Exclude Cash or Other Securities from Performance
- Exclude From Performance/Exclude ALL Securities From Performance
Filter Categories
You might want to filter this report to include certain categories or exclude them to drill down into performance for the account or group. By using a category filter, you can specify specific categories to include in the report or specifically exclude categories.
Customize Naming
You can customize the name of most selected columns and the Managed/Unmanaged labels used for the headings and captions.
Add Position Performance to the Reporting Dashboard
You can use dashboard views to see a pared-down, at-a-glance summary of the main dynamic report on your dashboard.
To learn more about creating and managing dashboard views, see Create and Share Dashboard Views.
For more information on customizing your dashboard, visit Working With Dashboard Modules.
Position Performance Report Settings
The following settings are available for the Position Performance report. Click the setting name for more details.
| Setting | Details | Available In... | ||
|---|---|---|---|---|
| Dynamic Report | PDF Report | Reporting Dashboard | ||
| Report Name | Designate a unique name for the view of the report view. | X | X | |
| Mark as Publicly Accessible | Share the report view. | X | ||
| Category Filter | Choose to include or exclude specific categories from the report. | X | X | |
| Section Title | Designate what the section will be called in the PDF report. | X | ||
| Theme | Designate what theme the section will use. | X | ||
| Header and Footer | Choose a unique header and footer for the section or use defaults. | X | ||
| Include Page Break After This Section |
Control where page breaks occur in PDF reports. |
X | ||
| Account Grouping | Control grouping of accounts and groups. | X | ||
| Include Reports for Closed Accounts | Show sections for accounts that were closed before the report as-of date. | X | ||
|
Select the date period you want to use for the report. Includes related setting:
|
X | X | X | |
| Group By/Then By |
Organize a report by various categories. |
X | X | |
| Show Subtotals |
Add subtotals to each grouping level when you Group by. |
X | X | |
| Unmanaged Asset Treatment |
Choose how you want to treat unmanaged assets on the report. |
X | X | |
| Show Returns As Net or Gross IRR or TWR |
Determine how returns should appear on the report. |
X | X | |
| Annualize Returns | Report the returns as annualized returns. | X | X | |
| Show Position Detail |
Show or hide underlying positions that make up subtotals. Includes related settings:
|
X | X | |
|
Include or exclude a totals row. |
X | |||
| Report SMAs as a Single Line Item | Choose how you want to see SMAs in the report. | X | X | |
| Report Security Groups as a Single Line Item | Choose how you want to see security groups in the report. | X | X | |
| Exclude All Securities Added to the Cash Settings Page | Show or hide securities added to the Cash Settings page. | X | X | |
| Available/Selected Columns | Choose which columns are included and in what order. | X | X | X |
| View Top (Number) Positions, Sorted By | In the dashboard report, designate how positions are displayed. | X | ||
| Preview | See a sample of the PDF report with the selected settings. | X | ||
| Use Inception Date | Report partial periods in PDF reports for instances where the account or group was opened after the beginning of the date period selected. | X | ||
Report Actions
To learn more about reports in Tamarac, see Introduction to Reports.
To learn more about how to generate a report, change the data displayed, print or export the report data, and more, see Basics of Working With Reports.
To learn more about creating and using PDF reports, see Understanding PDF Reports and Workflow: Generate a PDF Report.