Contents
Introduction
| Applies to: | |||
|---|---|---|---|
| Dynamic | Mobile | Client Portal | |
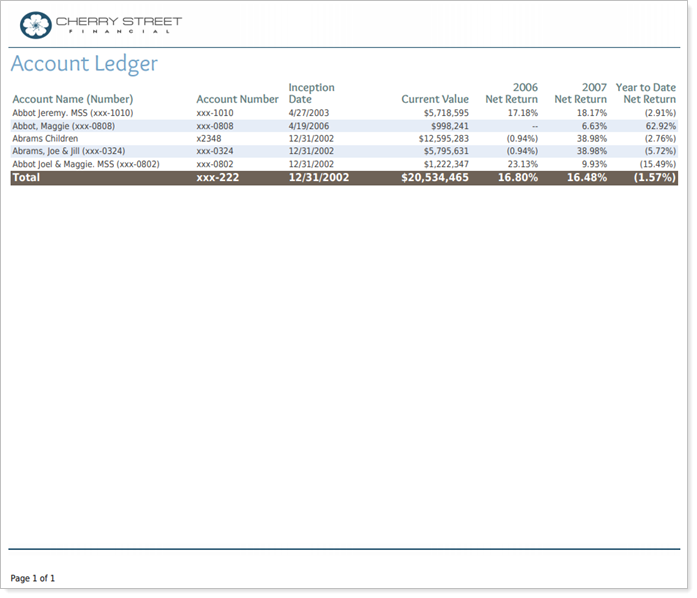
The Account Ledger section provides a tabular view of account characteristics for all accounts in the report. It is frequently used as a "table of contents"-style introduction to PDF reports, showing a list of what accounts or groups the client will see detailed in the following sections, along with some high-level information such as inception date, account description, current value, and returns.

If this section of a PDF template has no data, it won't display in the report. You'll be notified that no data was available on the PDF Report Status page and on the Template page if you generate a sample Template.
There are special considerations for closed accounts for this report. For more information, see Show Returns for Closed Accounts.
Note
This report only includes managed assets.
For more information about the difference between dynamic, interactive reports and PDF reports, see Introduction to Reports.
Why Use the Account Ledger Report?
In the Account Ledger report, you will find settings configurations that let you answer questions about performance for accounts and groups, such as:
-
Which accounts Are Covered in This Report? Show which accounts or groups will be reported on throughout the rest of the PDF template. You can control what order the accounts are shown using Sort Group Members for Reporting.
-
What is the current value of each of the accounts in the portfolio? Provide a broad, easy-to-interpret snapshot of the current value of each account in the group.
-
How Do Returns for an account Compare over time? Add up to five date periods to see how last year's returns compare with this year's, or compare returns for all accounts and groups within a group side by side.
See the Account Ledger in Action
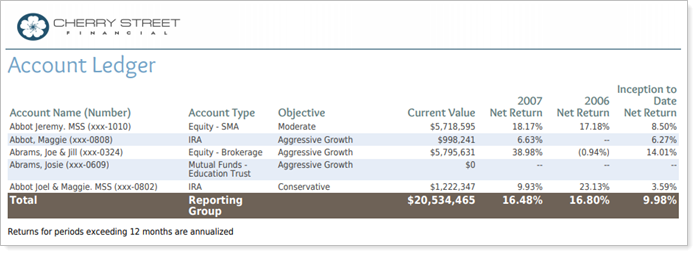
In their annual review, Cherry Street Financial provides clients with a year-end report. Because clients are most interested in returns, Cherry Street includes an Account Ledger with the following configuration:
-
Display returns for the year, the previous year, and from inception.
-
To help with understanding why returns may have been greater or less, they also include the Objective.
-
Since most clients think in terms of "my IRA" or "my brokerage account," they include the Account Type to make accounts easier to identify.

This Account Ledger layout makes returns accessible and easy for clients to understand.
Features of the Account Ledger Report
The Account Ledger report settings offer straightforward configuration for displaying account characteristics.
This report displays managed, unmanaged, and total account value, flows, returns and more data points from the Summary report. For details and considerations about these data points, see Summary Report Data Point Calculations.

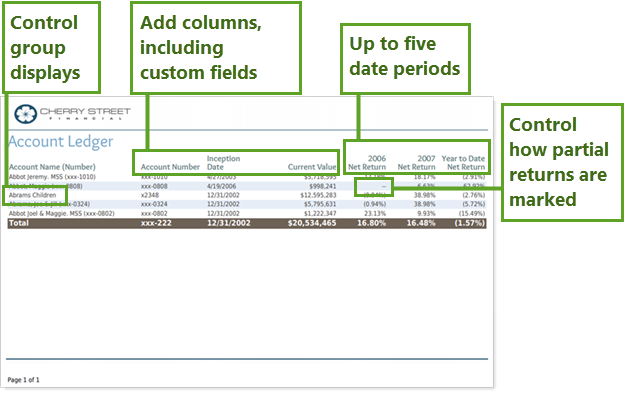
Control Display of Groups Within Groups
If a reporting group contains a sub-group, you can show or hide the sub-group's accounts to offer comprehensive detail or to simplify the report, depending on your client's needs.
Include Custom Fields
Add custom fields and some standard reporting data points as additional columns.
Add up to Five Date Periods
Choose between one and five date periods from among all the date periods available to you within your enterprise.
Customize the Partial Return Marker
Set how the report marks returns for accounts or groups with partial periods and, optionally, include the actual return date for partial periods.
Add Account Ledger to the Reporting Dashboard
There is no Account Ledger dashboard report available because the report is only available as a PDF report.
Account Ledger Report Settings
The following settings are available for the Account Ledger report. Click the setting name for more details:
| Setting | Details | Available In... | |
|---|---|---|---|
| PDF Report | PDF Dashboard |
||
| Section Title | Designate what the section will be called in the PDF report. | X | X |
| Section Alignment |
Align the PDF Dashboard report to the top, middle, or bottom of the vertical space. |
X | |
| Theme | Designate what theme the section will use. | X | |
| Header and Footer | Choose a unique header and footer for the section or use defaults. | X | |
| Include Page Break After This Section |
Control where page breaks occur in PDF reports. |
X | |
| Account Grouping | Control grouping of accounts and groups. | X | |
| Report Direct Member Groups as a Single Line Item |
Show or hide all the direct members of groups within a group. |
X | X |
| Show Returns As Net or Gross |
Determine how returns should appear on the report. |
X | X |
| Annualize Returns | Report the returns as annualized returns. | X | X |
| Partial Returns |
Choose how to mark data points that have partial returns. |
X | |
| Show Actual Return Dates |
Show the actual start date for partial period returns. |
X | |
| Select the date period you want to use for the report. | X | X | |
| Use Inception Date | Report partial periods in PDF reports for instances where the account or group was opened after the beginning of the date period selected. | X | X |
| Available/Selected Columns | Choose which columns or rows are included and in what order. | X | X |
| Preview |
See a sample of added columns or rows with the selected settings. |
X |
Report Actions
To learn more about reports in Tamarac, see Introduction to Reports.
To learn more about how to generate a report, change the data displayed, print or export the report data, and more, see Basics of Working With Reports.
To learn more about creating and using PDF reports, see Understanding PDF Reports and Workflow: Generate a PDF Report.
