Contents
How Intervals Works on the Firm Revenue Report
| Applies to: | ||
|---|---|---|
| ✔ Dynamic | Client Portal | |
This setting allows you to designate how the included billing histories are aggregated chronologically in the chart and table. For example, you can choose to see revenue aggregated monthly if you want to closely track individual advisors' revenue goals, or you can see revenue aggregated annually when looking at firm-wide revenue.
Depending on your billing cycle, some intervals will not display as well as other intervals. For example, if you bill quarterly, a monthly interval may not display a report with data as relevant to you, whereas a quarterly interval may help to better tell the story.
In Dynamic Reports

You must select at least one interval. By default, the interval is set to Quarterly.
To set the report billing interval, choose a period from the following options:
-
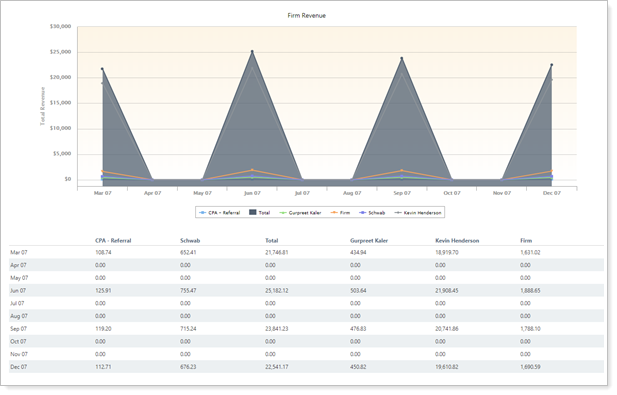
Monthly. For example, in this firm, all accounts are billed quarterly. When looking at a one-year date period with a monthly interval, the report shows revenue spikes each quarter when accounts are billed. This is also apparent from the table, which shows revenue only for months when billing occurred.

-
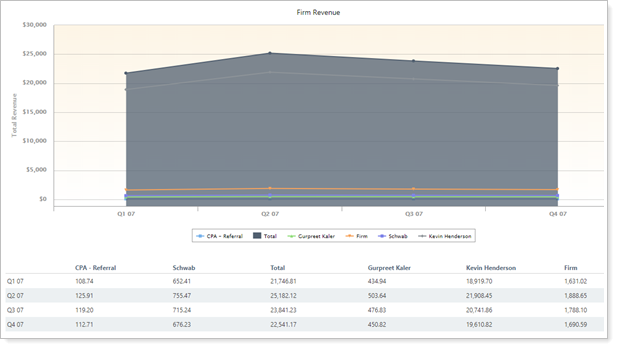
Quarterly. For example, in this firm, all accounts are billed quarterly. When looking at short date periods such as one year, the quarterly interval is effective.

-
Semi-Annually.
-
Annually.
In PDF Reports
This report is available for dynamic reports only.
