
Contents
Introduction
| Applies to: | |||
|---|---|---|---|
| ✔ Dynamic | Mobile | Client Portal | |
The Firm Revenue report aggregates billing data into one report, allowing comprehensive revenue distribution analysis and tracking at the firm and advisor level over a variety of date periods.
In order to track revenue, Tamarac Reporting uses payout distributions to designate what percentage of an account's revenue is attributed to whom—the firm, one or more advisors, or even third parties like custodians. Then, when the account is billed, the billed amount is split according to the designated payout distributions. Those distributions are then aggregated and displayed in the Firm Revenue report.
What each user sees on the report will always be limited to accounts they have access to. If your user can only see a subset of all the accounts, only that subset will be displayed on the report.
For information on how to set up the Firm Revenue report, see Set Up the Firm Revenue Report.
Why Use the Firm Revenue Report?
The Firm Revenue report collects firm-wide billing and revenue data that let you answer many revenue-related questions, such as:
-
How Much Total Revenue Has the Firm Received over a Designated Period? You can choose to see a visual representation of firm revenue, broken out by monthly, quarterly, semi-annual or annual intervals within the date period.
-
How much Revenue has an Advisor Brought in?Evaluate revenue on an advisor-by-advisor basis, or add as many advisors as you want for a quick comparison. If you want to see groups of advisors or the performance of different offices, you can create separate versions of the Firm Revenue report, one with one group of advisors and another with another group of advisors.
-
how much is Our Firm Paying Third Parties?Review how much revenue is being paid to external payees like custodians and compare it with the amount being paid to the firm and individual advisors.
See the Firm Revenue Report in Action: Evaluate Revenue Per Advisor
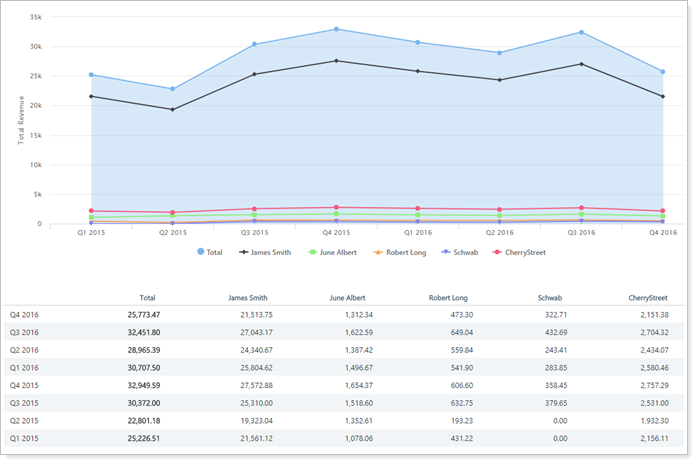
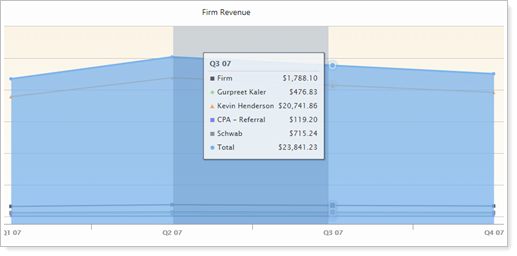
Cherry Street Financial has a goal of increasing their revenue a certain amount each quarter. Each advisor has specific revenue goals to help achieve this firm-wide initiative. To track this goal, they use a Firm Revenue report configured to display the revenue over the last two years, since the initiative started. The report is set at quarterly intervals, since their clients are billed quarterly, and it includes total revenue and revenue for all advisors.
The Firm Revenue report clearly shows the amount of revenue brought in by each advisor and the firm total for each period.
See the Firm Revenue Report in Action: Export Revenue for Analysis
An advisory firm wants to produce a detailed CSV file that they use for further quarterly revenue analysis. In Q1 2016, their billing included the following:
-
1 bill on 1/31/16 for Billing Group 1 for accounts A ($100) and B ($150)
-
1 bill on 2/10/16 for Billing Group 1 for accounts A ($115), B ($75), and C ($50)
-
1 bill on 2/10/16 for Billing Group 2 for accounts C ($105) and D ($220)
The normal billing export produces one line (for simplicity, this example only reports the total revenue.):
| Interval | Total |
|---|---|
| Q1 2016 | $815 |
Instead of that minimal export, the firm uses Export Detail on the Firm Revenue report to produce the following detailed CSV file:
| Interval | Billing Date | Billing Group Name | Account | Total |
|---|---|---|---|---|
| Q1 2016 | 2/10/16 | Billing Group 1 | A | $115 |
| Q1 2016 | 2/10/16 | Billing Group 1 | B | $75 |
| Q1 2016 | 2/10/16 | Billing Group 1 | C | $50 |
| Q1 2016 | 2/10/16 | Billing Group 2 | C | $105 |
| Q1 2016 | 2/10/16 | Billing Group 2 | D | $220 |
| Q1 2016 | 1/31/16 | Billing Group 1 | A | $100 |
| Q1 2016 | 1/31/16 | Billing Group 1 | B | $150 |
Features of the Firm Revenue Report
The dynamic report helps you easily filter and sort data to drill down to meaningful results. Report features include the following.
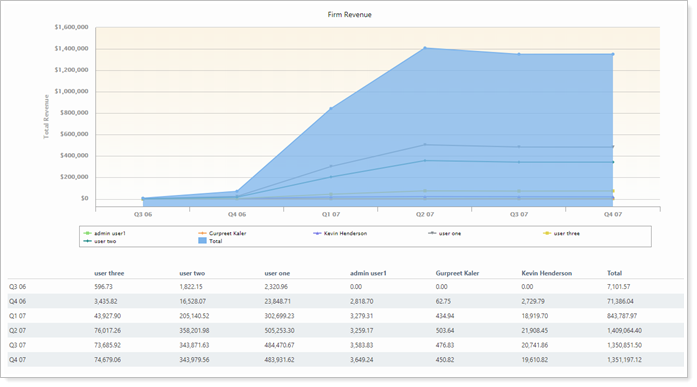
See a Revenue Summary Broken Down by Payee
Drill down into details of revenue for specific users over certain date periods and intervals. When you're looking at the Total revenue, the value will always display the aggregated firm total, regardless of what payees you've added. If you only include some payees, the values displayed may not sum to the Total value.
![]()
Export Revenue Details
Export the Firm Revenue report to CSV for a detailed breakdown of revenue for the periods selected, including billing date, billing group, account, and amount billed for each account.

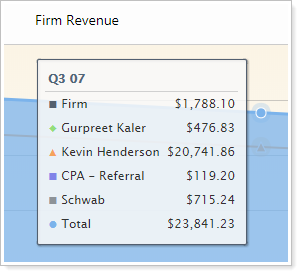
Use Tooltips to See Details
Hover over a data point to see details. You will see a tooltip and the matching category will be highlighted wherever it appears in the chart or table.
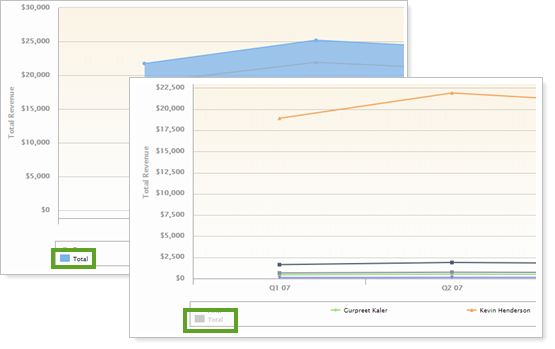
Customize Data Displayed
Click data points in the chart legend to show/hide data points.
Zoom In or Out to Change the View
Zoom in on the allocation over time chart by clicking and dragging to select an area. You can then scroll through the zoomed area by holding down the Shift key and dragging to the left or right. Reset your zoomed chart quickly by clicking the  button.
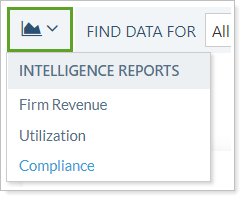
Switch Between Business Intelligence Reports
Use the report switcher to quickly navigate between business intelligence reports.
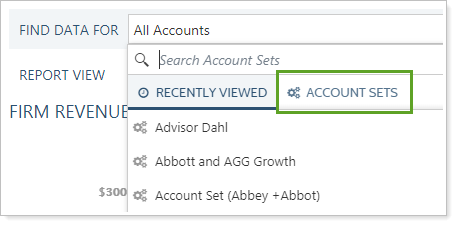
Review Data for Account Sets Only
When you use the Firm Revenue report, you'll notice that the Find Data For list only displays the Account Sets tab. By default, the report displays the All Accounts account set, but you can review data for any existing account set. For more information on account sets, see Group Accounts Into Account Sets.
Create a Firm Revenue Report Dashboard View
There is no Firm Revenue report dashboard report available.
Firm Revenue Report Settings
The following settings are available for the Firm Revenue report. Click the setting name for more details.
| Setting | Details | Available In... |
|---|---|---|
| Dynamic Report | ||
| Report Name | Designate a unique name for the view of the report view. | X |
| Select the date period you want to use for the report. | X | |
| Intervals | Set the interval reported within the selected date period. | X |
| Include Accounts | Filter the report to see all or only specific groups of accounts. | X |
| Include Firm Revenue |
Show or hide revenue attributed to the firm. |
X |
| Include Revenue Allocated to Advisors |
Show or hide revenue attributed to one or more firm users. Includes related settings:
|
X |
| Include Revenue Allocated to Other Payees |
Show or hide revenue attributed to one or more Other payees. Includes related settings:
|
X |
| Include Total Revenue | Show or hide the total amount of revenue generated. | X |
Report Actions
To learn more about reports in Tamarac, see Introduction to Reports.
To learn more about how to generate a report, change the data displayed, print or export the report data, and more, see Basics of Working With Reports.
To learn more about creating and using PDF reports, see Understanding PDF Reports and Workflow: Generate a PDF Report.