
Contents
Report Studio
Create custom dates and date periods in Report Studio reports
What's changing
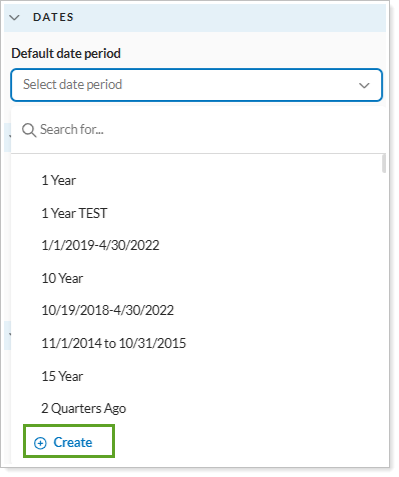
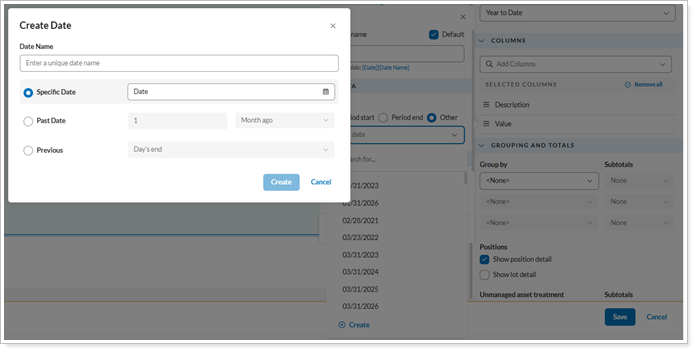
Report Studio now lets you create custom dates and date periods as you build a report module. You can tailor a report module to a specific timeframe without adding the dates to your global date settings first. You can create new date periods and custom As of dates directly from the module and column settings, including custom dates for value columns and custom periods for return columns, to analyze performance over specific timeframes. Report Studio saves these custom dates only within the module you’re editing, so your global date list stays clean.
Why you'd use it
Use this feature when your standard firm-wide date periods don’t meet a reporting need. For example, you can create a timeframe for a specific market event or a client’s custom fiscal period. Because you create these dates on the fly, you can respond to client requests without leaving your report design.
How to get started
To create a custom date, open a report in Report Studio, select a module, and go to Module Settings or Column Settings. Select the option to create a new date or date period, enter your parameters, and the module updates to reflect the custom timeframe.
Additional information
For more information about creating custom date periods, see Create a custom date or date period in Report Studio.
Customize category and series colors and line markers in Report Studio bar and line charts
What's changing
Using color to separate data clearly helps you communicate with your clients. This release expands the display options for bar and line chart modules in Report Studio to let you control how data series are colored and marked, so your reports look cleaner and more intentional.
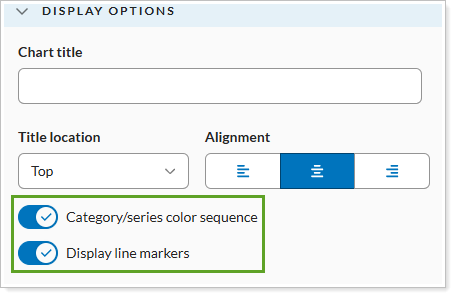
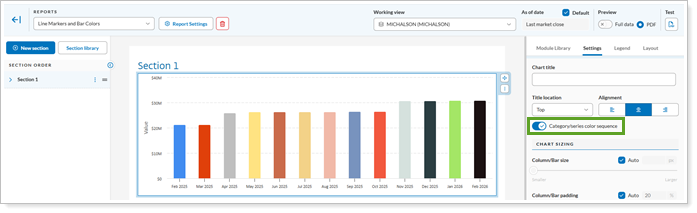
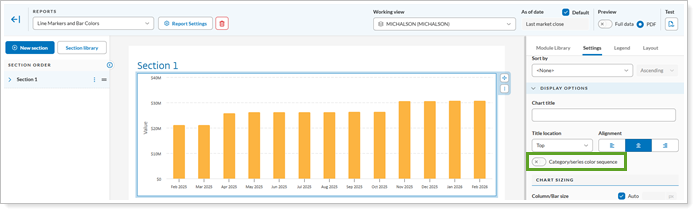
Category/series color sequence. Turn on this option to choose between a multi-color sequence and one consistent color for the series.
-
Category/series color sequence on
-
Category/series color sequence off
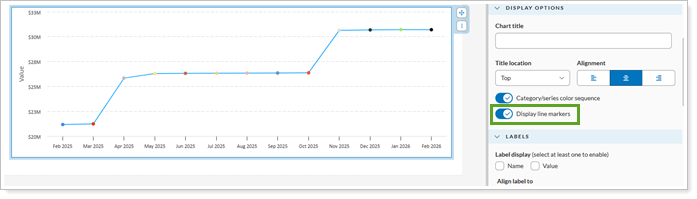
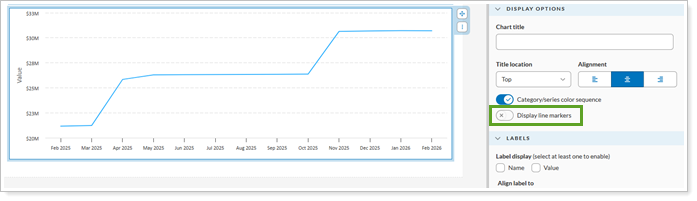
Display line markers. Show or hide point markers on line charts for a more streamlined appearance.
-
Display line markers on
-
Display line markers off
Why you'd use it
Use these options when the default color and line settings don't suit your data. For example, if you chart performance by year, turn off Category/series color sequence to show the whole series in one color, which makes the chart easier to read. Or hide line markers on charts with many data points so the overall trend stands out.
How to get started
To access these new settings, open a report in Report Studio and select a bar or line chart module. In the module’s Display Options section, turn on or off the Category/series color sequence and Display line markers to your preference.
Additional information
For more information about bar and line charts in Report Studio, see Using the Column-Bar-Line Module.
Easier to read labels on Report Studio bar and line charts
What's changing
Report Studio now adjusts the number of axis labels on bar and line charts automatically. When a chart is grouped by month, quarter, or year, Report Studio skips some labels so they don't overlap. Every interval still appears as a bar or line point.
Why you'd use it
You’ll see this happen automatically for client reports that feature long-term performance or historical data. You can present detailed monthly or quarterly trends without unreadable, crowded axis labels. For example, if you present a three-year monthly performance chart, labels now appear at clear intervals, such as every third month.
How to get started
No action is needed. These changes will apply after the release.
Platform setup
Track daily data reconciliation directly with the new Account Publish Dashboard
What's changing
Previously, Tamarac synced your accounts once a day. As we move to a custodian-by-custodian reconciliation and publishing model, we're building tools to help you track the status of your data. The new Account Publish Dashboard gives you a clear view into that process as it happens.
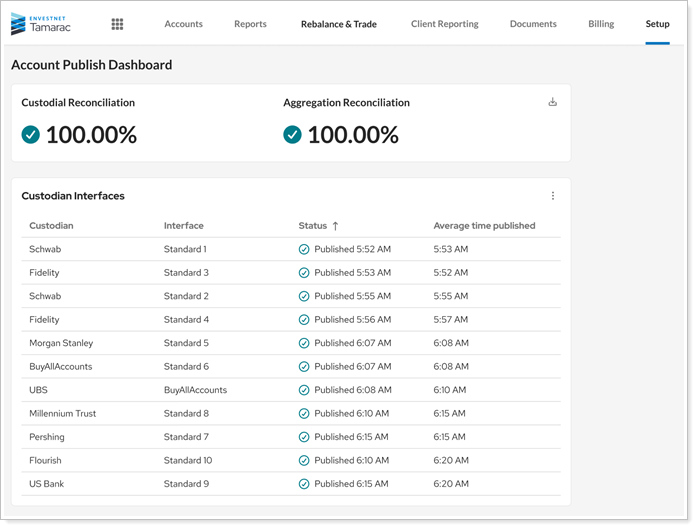
The dashboard shows you the following reconciliation information:
-
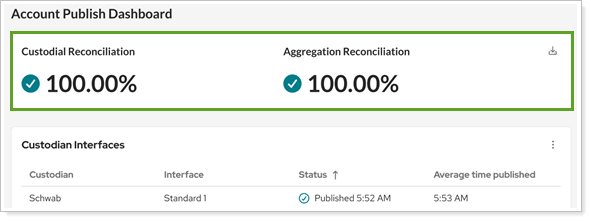
Custodian and Aggregation Reconciliation percentages. These reflect reconciliation status across all published accounts as of the last time each account was published. They update each time your accounts publish.
-
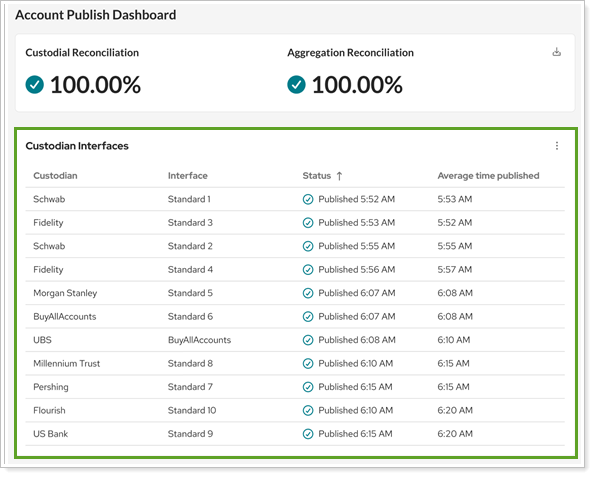
Custodian interface statuses. A list shows each custodian interface your firm uses, whether it has published today, and its average publish time. You can choose to show interface names or only custodian names.
-
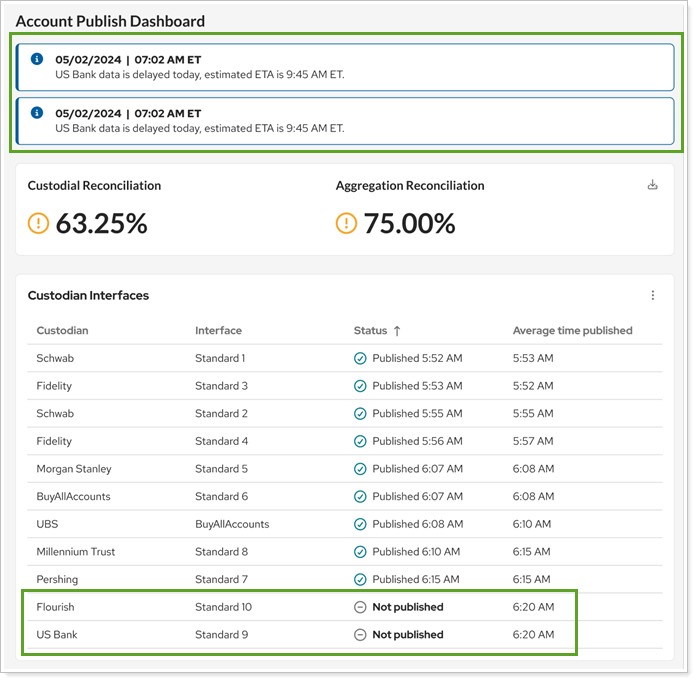
Operational messages. These messages, created by the Envestnet Operations team, alert you if there's an issue with reconciling any of your data. Messages include the status and time of the update and appear only when they apply to your firm and custodians.
You can export this data in the new Share Reconciliation bulk report.
Why you'd use it
The Account Publish Dashboard gives you and your firm's administrators visibility into the publishing process, so you can see what data is available, what is still processing, and whether any issues need attention before you start your day.
How to get started
In Tamarac Reporting, under Setup, select Account Publish Dashboard.
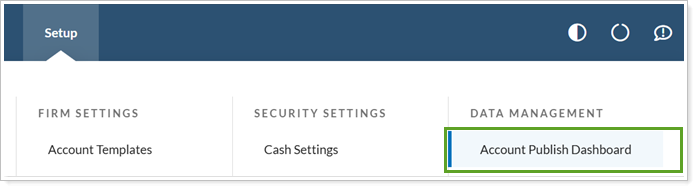
Enterprise admins see this page automatically. Other users need the new Setup | Account Publish Dashboard permission to see the page.
Additional information
For more information, see Track data reconciliation with the Account Publish Dashboard.
Access account reconciliation data any time with new bulk report
What's changing
In the past, you accessed reconciliation data through a once-daily post-sync reconciliation report available on the FTP site. As part of our ongoing transition to a more seamless sync process, you can now access the latest available reconciliation details for any account at any time using the new Share Reconciliation bulk report.

The Share Reconciliation bulk report includes familiar columns from the Account Holdings bulk report, along with the following new Holdings Reconciliation columns:
-
Custodian Name
-
Custodian Quantity
-
Interface Name
-
Position As-Of Date
-
Quantity Difference
-
Reconciliation Frequency
The report always shows the most recent reconciliation data available for each account. Each time you publish an account, Tamarac replaces that account's previous reconciliation data with the latest results.
The Share Reconciliation Bulk report includes only custodian reconciliation data. It doesn't include manual security snapshot positions, ownership accounts, or sleeve accounts.
Why you'd use it
Use the Share Reconciliation bulk report to review the latest available reconciliation data before making decisions for your clients. You can access position-level reconciliation details on demand without waiting for a post-sync report.
How to get started
To access the bulk report, under Reports, select Bulk Reports. Select Create new report and in Report type, choose Share Reconciliation.
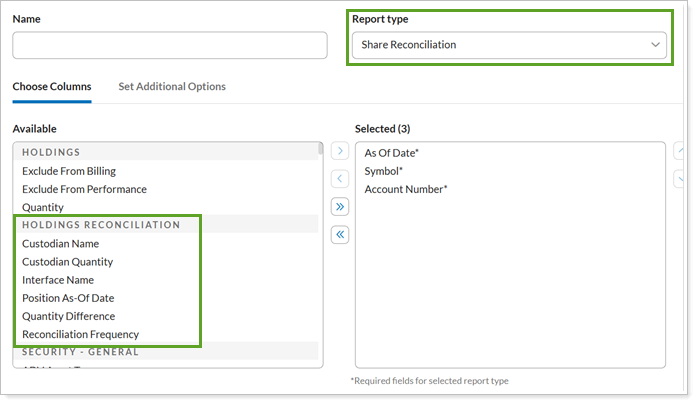
Configure the report columns as desired. On this report, you don't need to specify an as-of date because the report always uses the latest available reconciliation data. To see the date associated with each position, include the Position As-Of Date column.
When you're ready, run the report.
Additional information
For more information about tracking reconciliation on the live dashboard, see Track data reconciliation with the Account Publish Dashboard.
For more information about generating bulk reports, see Create, Edit, or Delete a Bulk Report and Bulk Report Descriptions.