 Back
Back Home > Tamarac Reporting > Clients and Client Portals > Client Portals > New Client Portal > Introduction to the Spending Page
|
Back |
Home > Tamarac Reporting > Clients and Client Portals > Client Portals > New Client Portal > Introduction to the Spending Page
|
Introduction to the Spending Page
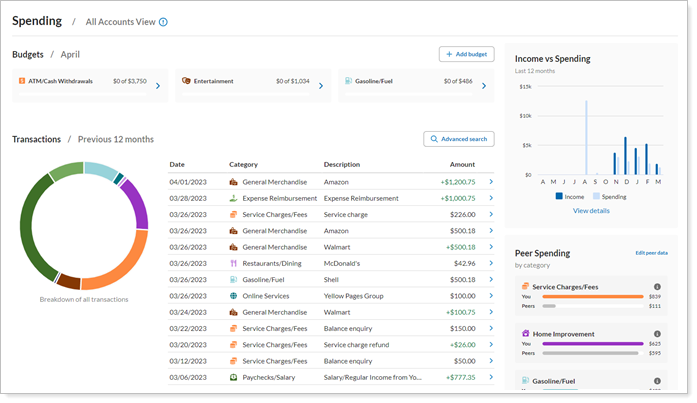
To achieve financial wellness and accomplish their long-term goals, your clients need to make informed spending choices every day. On the Spending page in the client portal, you can offer your clients budgeting tools and a consolidated view of bank account and credit card transactions to give them the information they need to make daily spending choices that support their financial goals.
The Spending page helps to answer questions about daily transactions and monthly budgeting.
The Spending page and all its features use linked bank and credit card account transactions. Before clients can use the Spending page:
You must enable external account linking. For more information, see Allow Clients to Link Accounts in the New Client Portal.
The client must link bank accounts and credit cards.
Some clients want to closely monitor their monthly expenses to stay on track with their financial goals. They’ll appreciate the budgeting tools on the Spending page, which provide a powerful and intelligent system for staying on budget.
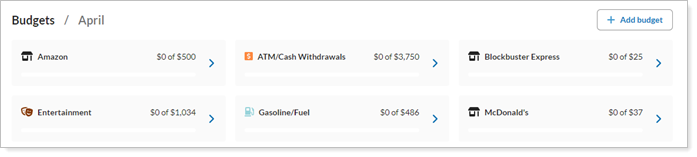
Smart budgeting on the Spending page helps clients answer category- and merchant-level spending questions like:
Am I within my clothing budget? Clients can create monthly budgets for a wide variety of categories such as clothing, groceries, home improvement, and more. Transactions are automatically sorted into the correct budget categories based on merchant classifications.
Am I spending more on utilities than I expect? Each budget provides a detailed list of all the transactions that go into that budget, giving clients the information they need to evaluate and, optionally, adjust their spending.
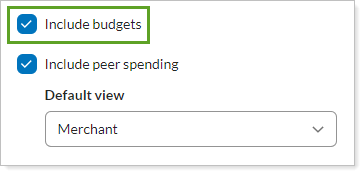
You can include or exclude this section, as desired. It's included by default. To include the section, select Include budgets in the configuration tool.
This section shows data as of the end of the previous month. If today is April 5, March will be the most recent month shown.
Part of staying on budget is monitoring how much money comes in and goes out each month. Clients ask, "Am I regularly spending more than I'm earning? How much am I earning and spending every month?"
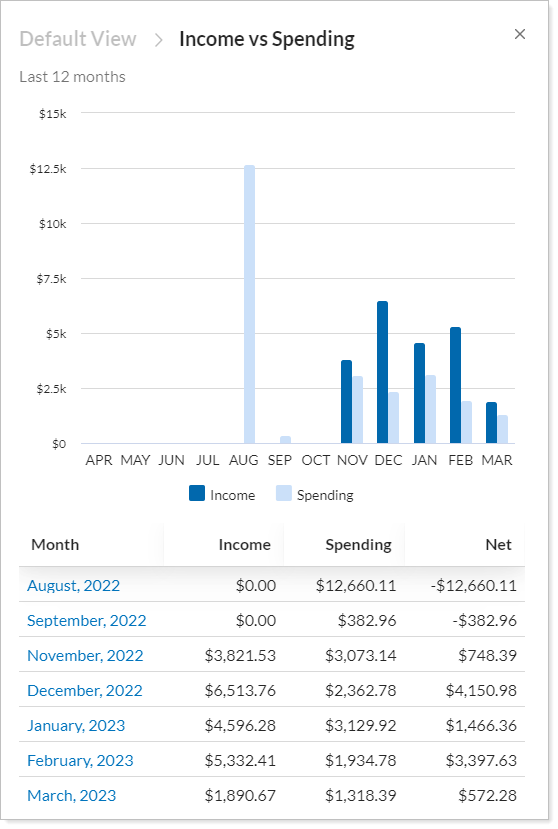
The Income vs Spending module on the Spending page answers these questions with a high-level overview of total income and spending for the previous 12 months, excluding the current month. Spending and income values come from linked bank and credit card account transactions.
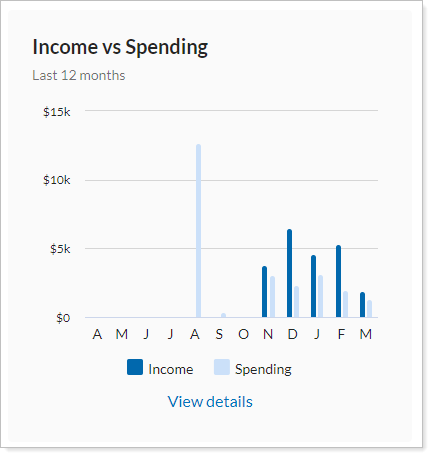
This high-level overview is useful, but clients can drill down for more detail about each month's spending and income--and even select a month to review all the transactions for that month.
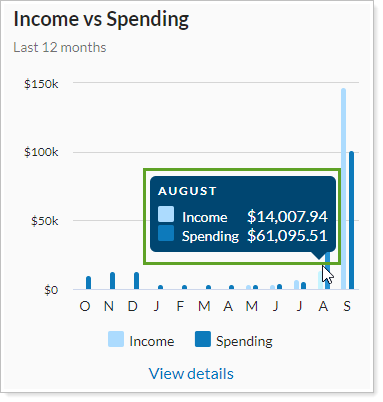
Hover text shows spending and income values for a particular month when a client places the mouse cursor over a bar.
This section is always included in the Spending page.
To help clients answer the question, “When and where did I spend my money?” the Spending page Transactions section shows transactions for the last 12 months, with access to more records and details through an advanced search.
![]()
In this section, clients can access additional transaction details and, if needed, recategorize the transaction to improve tracking accuracy.
![]()
They can also explore transactions by date, account, category, merchant, or amount using the Advanced Search.
![]()
This section is always included in the Spending page.
This section shows data as of the end of the previous month. If today is April 5, March will be the most recent month shown.
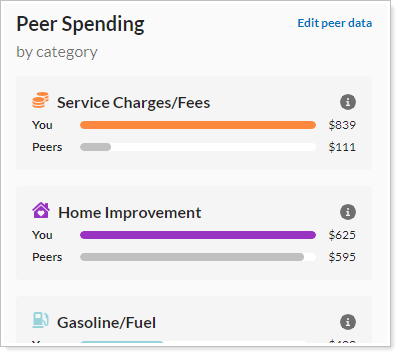
Some people are highly motivated by comparing themselves with others. These clients could benefit from seeing their spending alongside how much their peers spent. Not only can the comparison help clients gauge whether they’re spending an appropriate amount on any given category or merchant, but it can motivate them to adjust their spending accordingly.
The Peer Spending section uses linked account transaction data to calculate how much a client has spent at a particular merchant or category. Then it compares that value with an aggregated spending value from peers—a large, anonymized group of people in similar financial circumstances. Clients see this comparison in side-by-side bar charts that show the six merchants or categories where they spent the most money in the period.
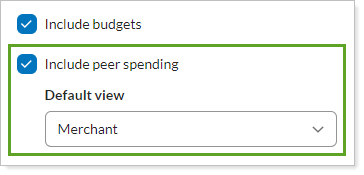
You can include or exclude this section, as desired. It's included by default. To include the section, select Include peer spending in the configuration tool.
By default, the widget uses national average data for peers. But pending patterns differ depending on location, age, and income ranges. To improve the accuracy of the definition of peer for your individual client, the client can refine details of their peer segment. This information allows us to show peers who are more similar to the client, and therefore have more comparable spending patterns.
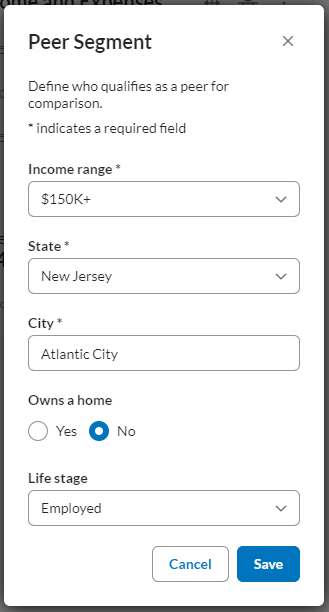
We may not always have more detailed data for a specific segment. Clients may enter more peer segment details and still see national data, depending on what’s available for their peer group from our aggregated data.