
Contents
New Security Cross-Reference Report
We're pleased to introduce the new Security Cross-Reference Report. This report lists all accounts and households that hold one or more securities that you specify. This report is based on the current trade date.
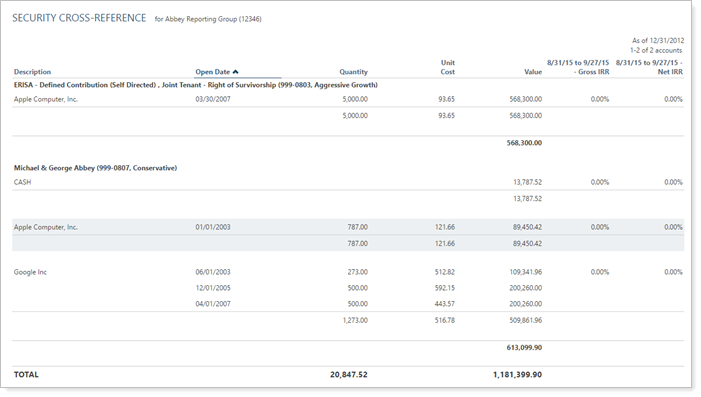
To view the dynamic Security Cross-Reference Report, follow these steps:
-
On the Reports menu, click Security Cross-Reference.
-
In the Search accounts box, start typing the number or name of the account for which you want to run the Security Cross-Reference Report. When you see it in the Find data for list, click Change. If you want to see all accounts on the report, click All Accounts in the Find data for list, and then click Change.
-
Click Edit next to the Select Security Cross-Reference view list.

-
Complete any of the following options:
| Report Setting | More Information |
|---|---|
| Report name |
Type a name for the report. The name you type in this box will appear in the Select Security Cross-Reference view list. |
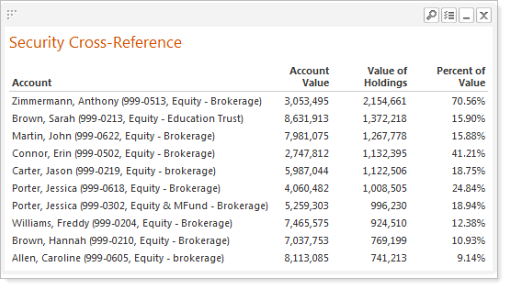
| Dashboard view |
Choose the sorting preference and number of accounts that you want to appear on the report when it's added to the Tamarac Reporting dashboard.
|
| Accounts per page | Choose the number of accounts you want to appear on each page of the report. You can choose 20, 50, or 100 accounts. |
| Include unmanaged assets | Use this check box to specify how unmanaged assets are treated in the report. If you select this check box, unmanaged assets are included in the report. If you clear this check box, unmanaged assets are filtered out of the report. |
| Include non-taxable accounts | To include all accounts in this report, select this check box. If you don't want non-taxable accounts on the report, clear this check box. |
| Include SMAs |
Select this check box if you want Tamarac Reporting to include separately managed accounts on the report. If you do not want separately managed accounts on the report, clear this check box.
|
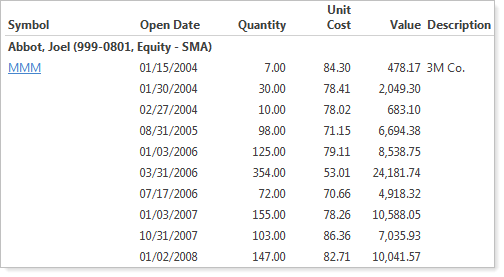
| Show lot level detail |
Select this check box if you want to view detailed information about the securities at the lot level.
|
| Available/Selected columns |
Choose the columns you want to appear on the report.
|
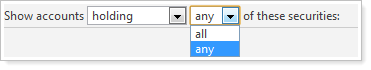
| Show accounts holding/not holding any/all of these securities |
Choose if you want Tamarac Reporting to show accounts that are holding or not holding any or all of the security you specify.
If you choose any, Tamarac Reporting will return results for all accounts holding one or more of the securities you specify.
If you choose all, Tamarac Reporting will only return results for accounts holding all of the securities you specify.
|
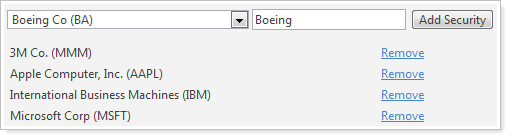
| Add security |
In the Search securities box, start typing the name or ticker of the security you want to search for. When you see it in the list, click Add Security. Repeat these steps for each security you want to appear on the report.
|
-
When you are finished customizing the report, click Apply. The customized report appears on your screen.
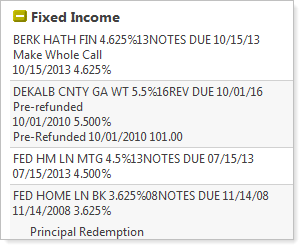
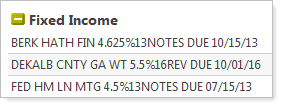
Include the Maturity Date and Annual Income Rate in the Fixed Income Description
With this release, you have the option to include the maturity date and annual income rate in the fixed income description for:
-
Fixed Income
-
CDs
-
Mortgage-Backed
-
Unit Trusts
-
Options (maturity date only)
-
T-Bills
-
Commercial Paper
| With Long Description... | Without Long Description... |
|---|---|
|
|
The information we include is based on the extended description you set up in PortfolioCenter.
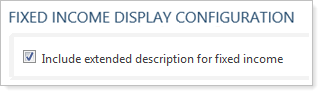
To enable this option, follow these steps:
-
On the Setup menu, click Options.
-
Under Fixed Income Display Configuration, select the Include extended description for fixed income check box.
-
Click Save.
Assign Colors to Indexes
When viewing Advisor View PDF reports, sometimes it's confusing to visualize indexes when the index colors vary between reports - for example, green may represent S&P 500 on one report and Russell 1000 on another.
To make the visualization of indexes easier, you can assign a color to an index. The colors you specify can be shared by your dynamic and PDF reports, creating a consistent look and feel for all reports and portal sites.
TIP
You can even create "color assignments." Color assignments sets of colors that Advisor View will assign to indexes, graphs, and categories. You can then assign these color assignments to your client views and PDF templates.
The color assignments you set will appear on the following reports:
-
Account Performance
-
Asset Allocation
-
PDF Holdings
-
PDF Projected Income
-
PDF Bond Analysis
-
PDF Position Performance
To assign a color to an index, follow these steps:
-
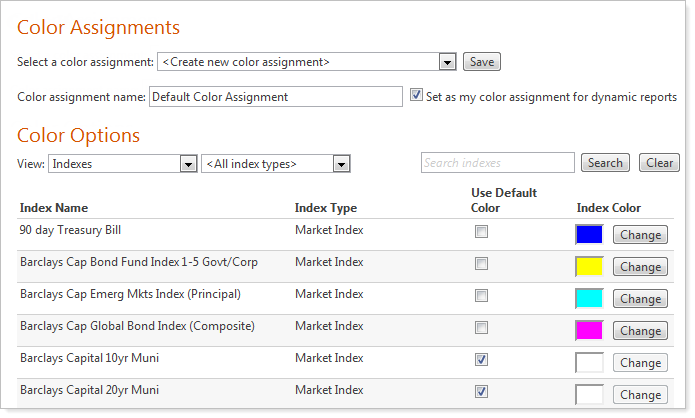
On the Setup menu, click Color Assignments.
-
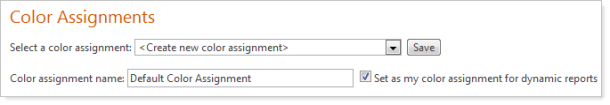
In the Select a color assignment list, choose Create new color assignment.
-
In the Color assignment name box, type a name for the color assignment. With Advisor View, you can create multiple color assignment templates and assign them to specific report templates as necessary.
-
If you want to set the color assignments as the default color assignments that you see on the dynamic reports, select the Set as my color assignment for dynamic reports check box.
-
Under Color Options, in the View list, click Indexes.
-
For the index where you want to assign a color, clear the Use Default Color check box. If you select this check box, Advisor View will automatically assign a color to the color option.
-
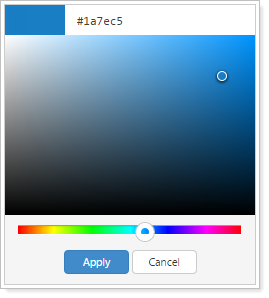
Click Change. The Color Selection window appears. Select a color from the grid or by clicking on any part of the colored area below. You can also enter an exact hexadecimal value in the large box. Click off the Color Selection window to close the dialog.
-
When finished assigning color categories, click Save.
View Separately Managed Account Categories on the Asset Allocation Report
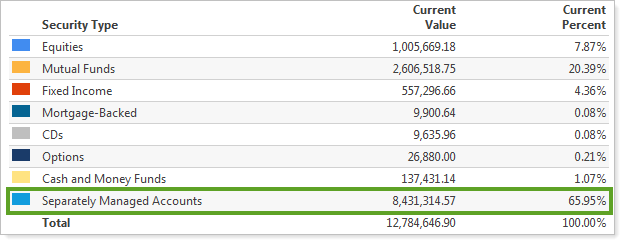
You now have greater control over how you view the dynamic Asset Allocation Report. Now you can view separately managed account (SMA) holdings at the group level that are based on the separately managed account customizations you've set up in Schwab Performance Technologies® PortfolioCenter™.
To check out this new feature, follow these steps:
-
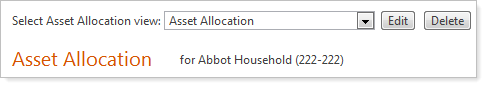
On the Reports menu, click Asset Allocation.
-
Click Edit.
-
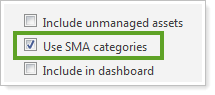
Select the Use SMA categories check box, and then click Apply.
View Separately Managed Accounts as a Single Line Item on the Projected Income Report
In the November release of Advisor View, we released the Projected Income Report, which shows you expected income from dividends, principal repayments, and coupons. While many of you were excited about the report, you wanted the ability to view projected income for separately managed accounts as a single line item.
With this release of Advisor View, we're excited to announce that we've added the ability to view projected income for separately managed accounts as a single line item on the Projected Income Report.
To see this new feature, follow these steps:
-
On the Reports menu, click Projected Income.
-
Click Edit.
-
Do one of the following:
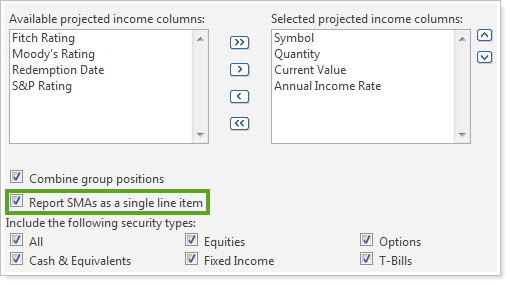
To view SMA projected income at the group level, select the Report SMAs as a single line item check box.
To view a detailed breakout of the SMA projected income, clear the Report SMAs as a single line item check box.
-
Click Apply.
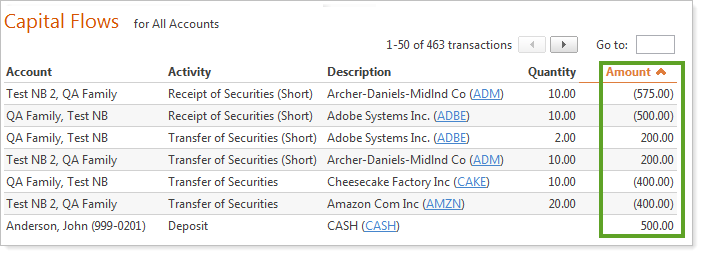
Capital Flows Report Updates
After this release, when you view the Capital Flows Report, withdrawals will now show as a negative number. Before this release, withdrawals appeared as a positive number. Withdrawals will also show as a negative number when you export the report to Excel®.
Assign Colors to the Graph Items on the Account Performance Report
With this release, you can also customize the color for each item that appears on the graphs on the Account Performance Report.
These items include:
-
Accounts
-
Allocation Weighted Benchmarks
-
Benchmarks
TIP
You can even create "color assignments." Color assignments sets of colors that Advisor View will assign to indexes, graphs, and categories. You can then assign these color assignments to your client views and PDF templates. For more information on color assignments, visit Report Themes.
To assign colors to the graph items on the Account Performance Report, follow these steps:
-
On the Setup menu, click Color Assignments.
-
In the Select a color assignment list, choose Create new color assignment.
-
In the Color assignment name box, type a name for the color assignment. With Advisor View, you can create multiple color assignment templates and assign them to specific report templates as necessary.
-
If you want to set the color assignments as the default color assignments that you see on the dynamic reports, select the Set as my color assignment for dynamic reports check box.
-
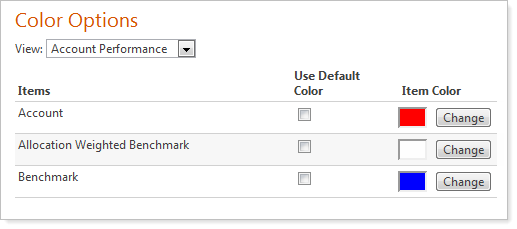
Under Color Options, in the View list, click Account Performance.
-
For the graph item where you want to assign a color, clear the Use Default Color check box.
-
Click Change. The Color Selection window appears. Select a color from the grid or by clicking on any part of the colored area below. You can also enter an exact hexadecimal value in the large box. Click off the Color Selection window to close the dialog.
-
When finished, click Save.
Realized Gains and Losses Report Updates
We've improved the Realized Gains and Losses Report by adding totals and subtotals for the Cost Basis and Net Proceeds columns of the report.
Accounts Page Performance Enhancement
In this release, we've improved the performance of the Accounts page. When expanding a reporting group that has a large number of underlying accounts, you'll now find that the page loads much faster than in previous releases.