
Contents
Client Portals and Menu Bar
Customize the New Look for Your Client Portal 
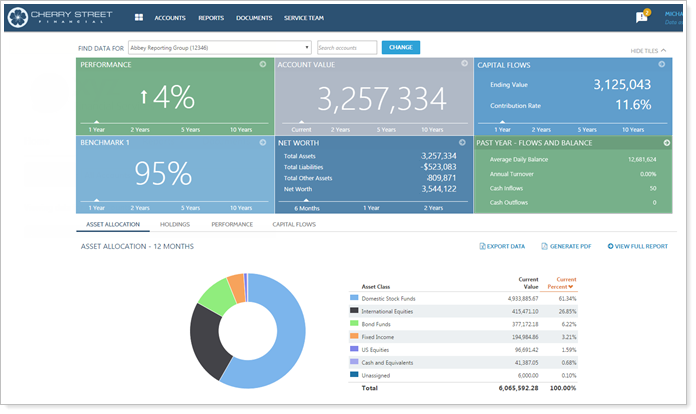
We're excited to introduce dramatic enhancements to the client portal that allow you to better engage your clients and appeal to the next generation of investors. You can now create a highly customizable client portal experience for your clients that matches your branding.
The new look is streamlined and we added functionality that can greatly improve the way you and your clients interact with the data you need. We'll continue to add client portal enhancements in upcoming releases as well, helping you keep your clients engaged and providing you with a competitive advantage in the industry.
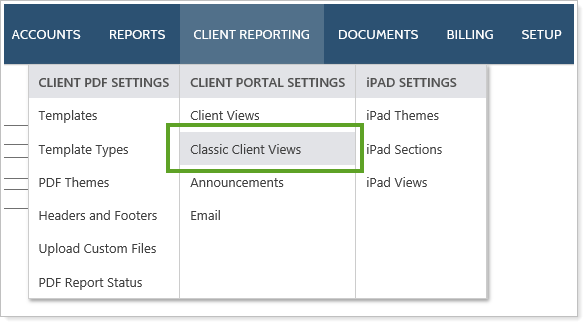
Your existing client portal views remain unchanged, so you can take time to set up and perfect the new views before rolling them out. You will see your existing views under Classic Client Views on the Client Reporting menu.
Important
When you upload the Client Information data set, you will only be able to upload for the new client views, and will no longer be able to upload for the classic client views.
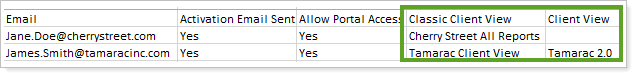
However, you will have two columns on the Client Information bulk report which show the type of view assigned to each client:
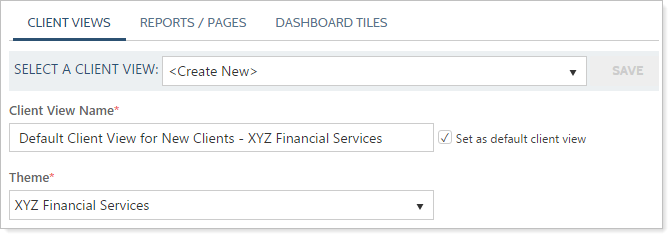
You can roll out the new client views as soon as you're ready, and we've expanded the Client Views screen so that your processes will be more efficient. You can now set up a report once and add that customization to multiple client views—saving you from recreating the report for each view.
With the new client portals, you'll be able to:
-
Create a site theme.Change the colors and options used in the pie charts, bar charts, and line charts and customize how the menu bar looks for you and your clients. You can have different site themes for each client, group, or internal user. The site themes will apply to dynamic reports, PDF reports, client portals, and reports on the iPad app.
Note
You can use your existing themes as well.
-
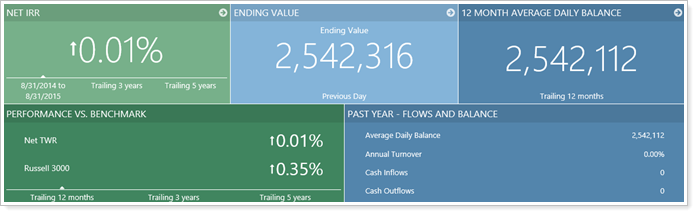
Create dashboard tiles.Provide at-a-glance information about client portfolios with customized dashboard tiles. You can create tiles from over 40 data points, such as return data, benchmarks, withdrawals, sales, etc. and then add them to your dashboard so your clients have a quick, visual summary of the data. You can also customize the text color and background color of the tiles for each client view.
-
Add Custom Pages.Include pages on client portals that allow clients to see account information, documents, service team information, or the dashboard summary. You can customize these pages, tailoring them to your clients' needs. For instance, new clients may not need access to the Accounts and Dashboard pages so you could choose to show only the Documents page and the new Service Team page.
The new client view dashboard page is designed as the hub of your enhanced client portal, combining dashboard tiles and customizable reports in an easy-to-use interface.
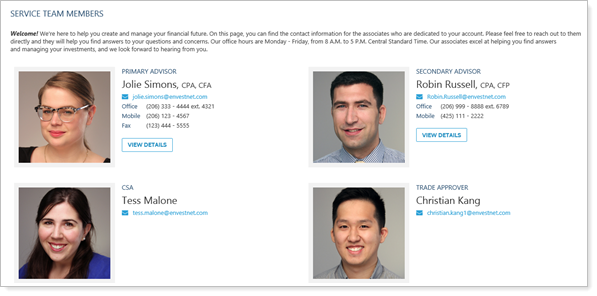
You can include the new Service Team page, which makes it easy for your clients to identify which advisors, customer service associates, and other employees they'll be working with at your firm. You can provide the contact information, photos, and additional details you choose for each role. Interactive email links make it simple for clients to contact service team members directly.
-
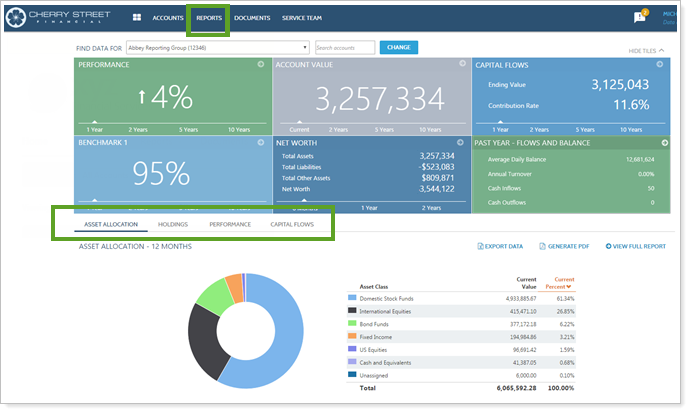
Create Client View Reports.Configure full reports such as holdings, performance and allocation reports for clients, and then choose which reports are included as tabs, and which are only available from the Reports menu.
Once you have created your tiles, pages, and reports, you can pull them together into a finished client view and assign it to your client portals.
Match Your Branding with a New Menu Bar and New Default Colors
As part of our commitment to creating the best possible experience for you and your clients, we're working to make the site navigation more intuitive and streamlined. With this release, we resized the menu bar so that more screen space is available for your data. You'll now be able to fully customize the menu colors to match your brand, visually identifying Advisor View as part of what your firm offers. The initial default color you'll see after this release is blue, which you can easily adjust to your firm's preference, previewing your choices to see exactly how they will look.
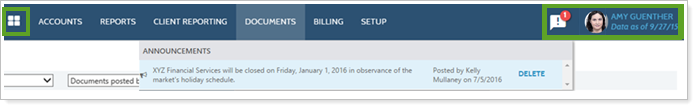
We're providing quick access to the Dashboard with a new icon, and an updated user area will allow you to personalize your site with a profile photo. You'll also see an announcement notification on the menu bar that will alert you to unread announcements so that you can quickly see information about holidays due to market closures, site maintenance, or other important and time-sensitive communications.
We also made small changes to some menu names and moved the Composites menu and its related options under Reports. The names of your User Management page permissions have been updated to reflect the new location, but your current permissions remain unchanged.
For more details about these enhancements, we've prepared online lessons that walk you through everything you need to know.
We highly recommend that you take time before the release to:
Create a Logo with a new background color
Because the new menu bar takes up less vertical space on your screen and has new default colors, your existing logos may need to be updated. We will resize your logos while maintaining a 4.5:1 aspect ratio to avoid distortion, but you may want to consider changing the background color. We recommend that you set a transparent background color for the logos on your site and client portals. Otherwise the logo will display on a solid-colored field that may not match your menu bar.
![]()
If you have a white logo, however, you may not want a transparent background. A white logo with a transparent background would be invisible on any page with a white background. Also, the logo assigned to the Household is used for clients' login screens and automatic client portal emails—if you use a transparent background, clients would be unable to see your company logo in these locations because the screen backgrounds are white. In this case, we recommend setting the logo background color to match the color of your menu bar.
Each Household has an assigned logo on the Settings page, and you will select your internal logo on the redesigned Themes page under the Setup menu. If you want to replace an existing logo, you will need to contact your Tamarac service team and provide the name of the logo you want replaced.
Note
As you create new logos going forward, there are some important things to keep in mind:
-
Use the following approved image file types: .BMP, .GIF, .JPG, .JPEG, .PNG (recommended).
-
Continue using ideal logo sizes going forward. Logos that are too large will automatically resize and may not look as expected.
-
There are 10 pixel margins on the left and right sides of the logo, but there are no margins for the top and bottom of the logo image.
-
The standard ideal logo size is 270 pixels by 60 pixels (4.5:1). To get a crisper appearance for higher resolution screens, you can set the logo size to 540 pixels x 120 pixels—note that although the logo on your menu will stay the same size, it will look larger on your clients' login screens and automatic client portal emails.
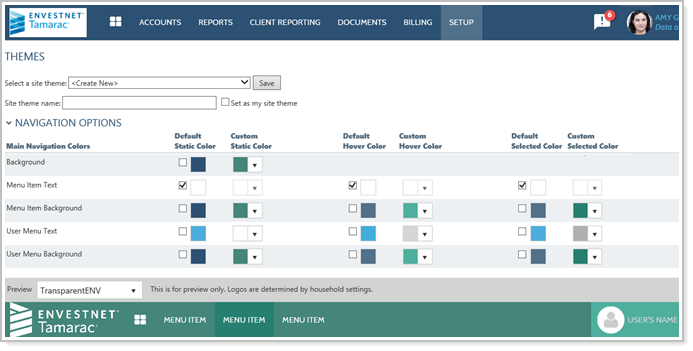
Plan colors for your menu bar and menu text
Prior to the release, you can work with others at your firm to select the colors you'll use for your internal site and your client portals.
If you like the default blue menu with white text, you won't need to make any changes. If you have a blue logo that would blend in with the default background, or if you prefer a custom color scheme, having an approved plan makes the transition quick and easy post-release—you'll be ready to enter your chosen hexadecimal color codes (e.g., #000000), preview your chosen colors, and then save your theme.
Note
Our default hexadecimal color codes are:
| #2C5172 |

|
#51708A |

|
#4EADDC |

|
#FFFFFF |

|
Set custom chart colors for reports
We're updating the default colors for report charts to bring you a simpler, more modern look.
To take advantage of the new default colors, you can retain your default settings and you'll automatically see the new color sequence after the release. If you were using the old default colors and want your reports to look the same, you can configure custom colors on the Themes page under the Setup menu.
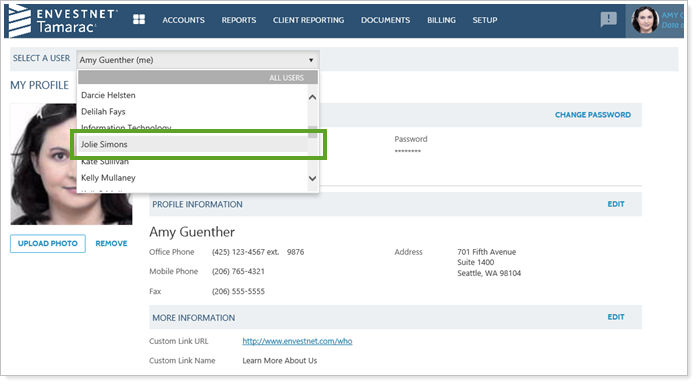
Set New options on the My Profile menu
The My Profile menu has been expanded to include contact information and profile details that your firm can add to a Service Team page on client portals. The Service Team page can include any of the information you enter, if your role is included on the page.
Your firm can choose whether you're able to set up your own profile information, or whether an administrator manages your information. If you have permission, you can edit the information by clicking the My Profile menu at any time. You can then add a photo, contact details, and additional details such as types of experience or links to related web sites.
If you don't have permission, you'll still be able to manage your password and dual factor authentication settings on this page, but your photo and profile details will be view-only.
Note
Administrators cannot see your password or change it.
You can send your administrator requests to change your profile information and he or she will be able to select your profile on the My Profile page.
Reporting
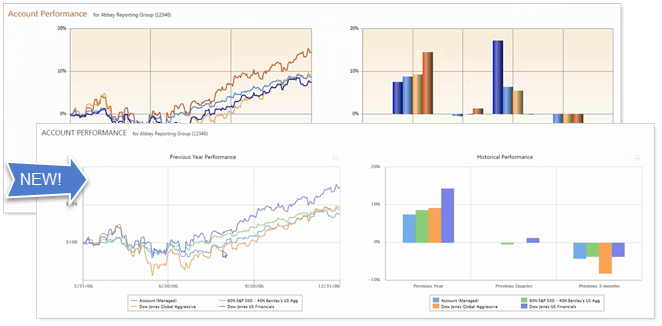
Charts on Dynamic Reports are Interactive
We think you'll be excited about the interactivity we've added to dynamic reports, making it much easier to identify and focus on the data that you want to see. With the interactive features, you'll now be able to show/hide data points, see details by hovering over a data point, zoom in, and scroll through a zoomed area. You and your clients will see a modernized look, with new chart colors for the default settings, and a new donut chart option. You'll also be able to print your dynamic charts by clicking a print button on the page.
The dynamic reports that include this interactive functionality are:
-
Account Performance
-
Asset Allocation
-
Account Analytics
-
Bond Analysis
-
Capital Flows
-
Projected Income
-
Summary
By interacting with the data, you'll be able to identify and use it more easily. For example, you can hover over a category in a pie chart and see details display, as well as seeing the category highlighted in the table below so that you can quickly find the information you want. If you have two pie charts on the page, you'll see the category highlighted for both so that you can quickly see how everything relates.
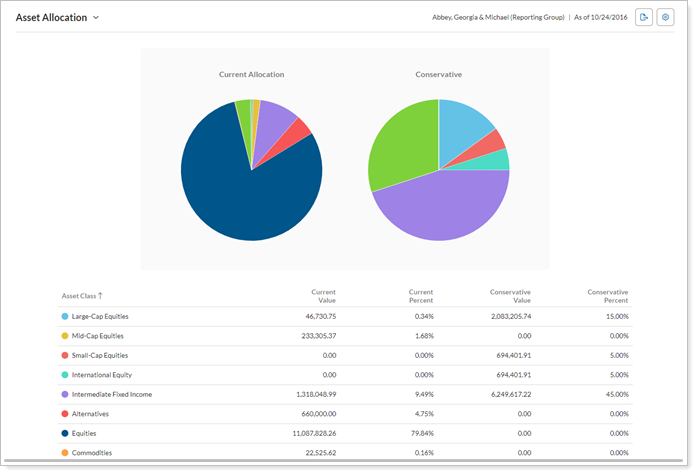
If you hover over a category in the table, you will see it highlighted in the pie chart, and if you click on the category, you can hide it from the chart. In the example below, the US Equities category has been hidden, and we also used the new donut display option to simplify the look of the chart.
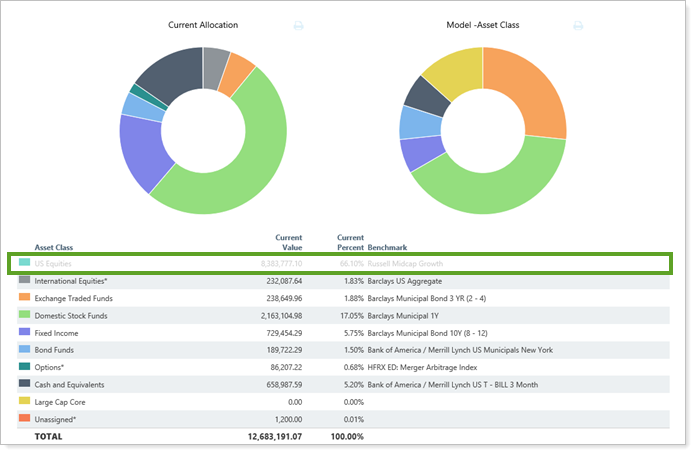
Along with the new interactivity, you'll also see that the pie charts now start at 12:00 instead of 3:00, and titles are now shown above the charts. You can also choose to display the charts next to your data, rather than above it.
Most of the same functionality is available for scatter plots—you can hover anywhere to see the data for the point you selected and show/hide categories so you can reduce distraction or add detail. In addition, with scatter plots you can zoom in to areas you want to view more closely by clicking and dragging in the desired area. You can then scroll through that zoomed view by pressing the shift key and dragging your mouse through the area. Bar charts allow zooming as well, along with clicking to display related details.
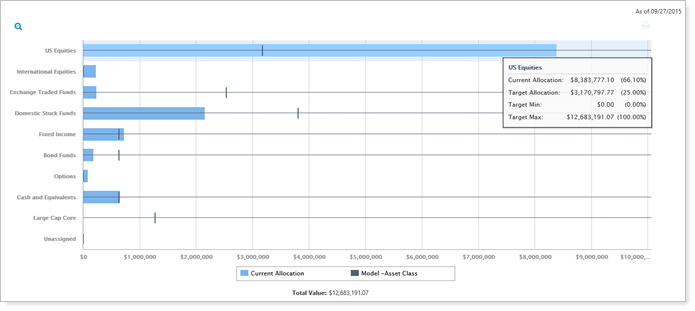
You'll also see a simplified dynamic bar chart for the Asset Allocation report, and when you compare current allocations with target allocations, you can see the same data with one set of bars now, instead of two sets. A line within each bar indicates the target allocation—the line starts at the minimum weight and you'll see a vertical mark that indicates the target weight. This visual consolidation of current and target allocations provides a fast and simple way to identify what you want to focus on.
Note
PDF reports will now drop the Asset Allocation section when there is no data to report, and you'll be notified that no data was available.
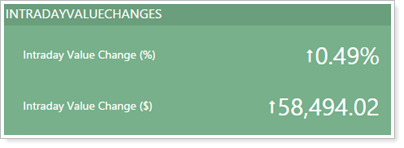
See Intraday Value Change in Dollars for the Dynamic Holdings Report
With this release, we made it possible to compare value changes in dollars throughout a day. If you use Advisor View as your data source and the report is using real time pricing, you can add this information as a tile on the dashboard.
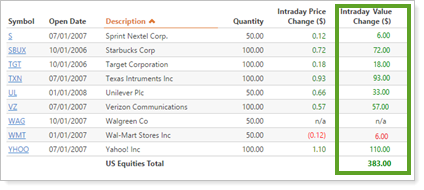
You will also have a new available column for Intraday Value Change ($) on the dynamic Holdings report. Negative values will show in red text, and positive values will show in green text.
If you are interested in enabling real-time pricing for your firm, please contact Account Management.
Expanded Capability for Manual Security Snapshots
You've asked us to add functionality to our manual security snapshots and we're excited to offer you many new features with this release.
Because we're committed to expanding our reporting, we'll be offering additional enhancements in upcoming releases as well. With Manual Security Snapshots, you can now:
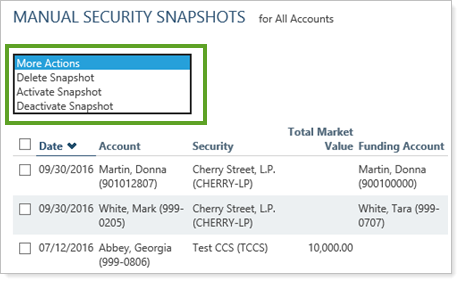
-
Take action in bulk using the More Actions menu—including deleting, activating, and deactivating snapshots.
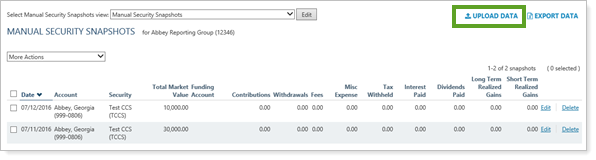
-
Upload manual security snapshots so you can easily identify and resolve any issues with updated error messages and warnings.
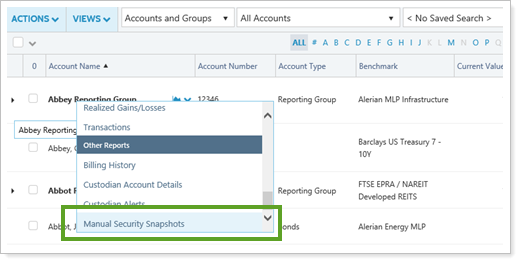
-
Access Manual Security Snapshots from the Accounts page if your permissions allow you to access the Manual Security Snapshots page.
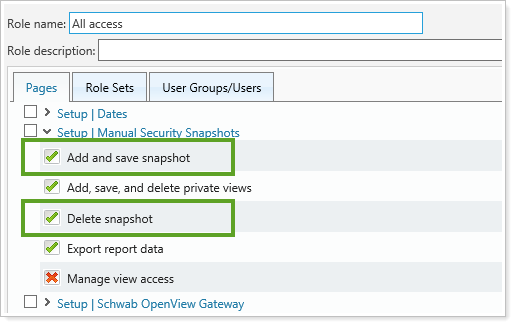
-
Set separate permissions for creating and deleting snapshots. The old Add, save, and delete permission is now two permissions: Add and save snapshot and Delete snapshot. Users must have delete permissions in order to delete snapshots.
New and Updated Fields
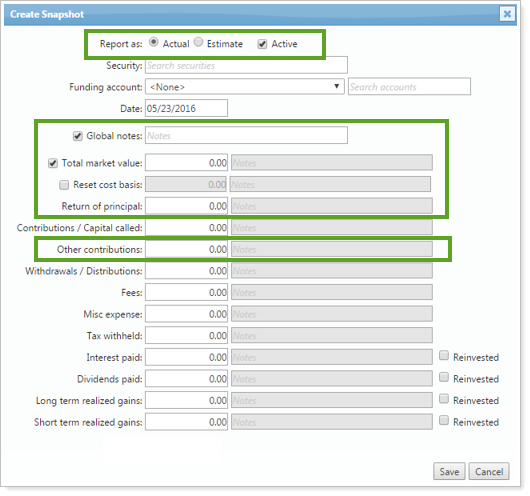
When you create or edit a snapshot, you'll see new fields on the Create Snapshot page, as well as some updated functionality for existing fields.
Now you can:
-
Create two types of snapshots—Estimate and Actual. Using an estimated snapshot allows reporting to continue if you're waiting for updated data from third parties. On the night of the release, all existing snapshots will be set to Actual.
-
Activate or deactivate snapshots. Deactivated snapshots will be ignored in reporting. On the night of the release, all existing snapshots will be set to Active.
-
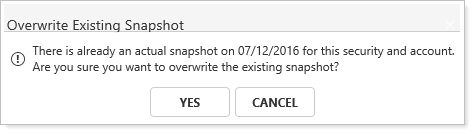
Overwrite snapshots—when you enter new snapshots, you can overwrite any Actual snapshot that already exists for that day. If you confirm that you want to overwrite the old snapshot, any previous Estimate for that snapshot will automatically be overwritten.
-
Add future dates to set up future snapshots. All date periods such as Month to Date, Quarter to Date, and Year to Date will now display future snapshots on the Manual Security Snapshots page.
-
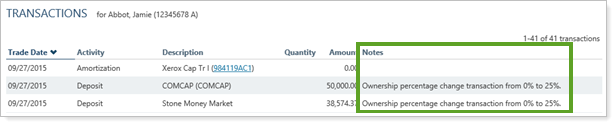
Add transaction notes—all notes will be displayed in the Transactions report under the Notes column.
-
Input snapshots that don't represent valuations—we will calculate the market value for you based off the other values in the snapshot and the previous market value.
eXample
If you disable the total market value field, the snapshot will automatically calculate the market value for you. If the previous snapshot had a total market value of $1,000 and there was a $100 contribution, then the result of your next snapshot would be $1,100.
-
Include negative values (although total market value and cost basis must still be positive values).
-
Enter cost basis for manual securities and reset it as necessary. This information will be available on the Holdings, Security Cross Reference, and Unrealized Gains/Losses reports, as well as the Holdings bulk report.
-
Enter a Return of principal value to specify how distributions affect cost basis. Return of principal affects cost basis, and withdrawals do not.
-
Include Other contributions—this allows for deposits outside the Committed Capital call schedule. You can track manual security contributions which impact the invested value and cost basis, but which don't impact the calculations that include Capital Called on the Committed Capital report.
-
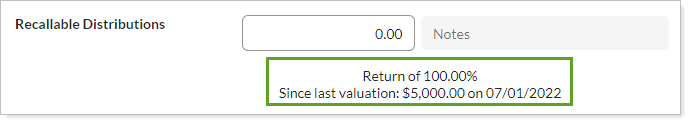
See the date of the last valuation—seeing the most recent valuation date helps you identify older data. Since snapshots include adjustments to market value, flows, and principal adjustments, the return shown will be calculated as a simple return.
Column Changes
For the following reports, the Open Date column will now reflect the date of the first snapshot for manual security positions on the account:
-
Position Performance (Dynamic and PDF)
-
Holdings (Dynamic and PDF)
-
Security Cross-Reference (Dynamic)
-
Unrealized Gains/Losses (Dynamic, PDF, Dynamic Dashboard, PDF Dashboard)
Usability
Discontinued Support for Internet Explorer 10
In order to incorporate the latest features of modern Web browsers, we're discontinuing support for Internet Explorer 10 as of July 2016.
Important
Please take the time to upgrade to Internet Explorer 11 or later. We are committed to continually improving the products and services we offer, and we want you to get the most out of new functionality we are developing.
If you are using Internet Explorer 10, you may find that some features no longer work properly after July 2016. If you have any questions, please contact your dedicated Tamarac service team at TamaracSupport@envestnet.com.
.