
Contents
|
Introducing the MoneyGuide Financial Plan Summary Report Auto-Refresh for the MoneyGuide Data Market Charts Report Deprecated New Manual Securities Data Point: Manual Security Yield |
Integrations
Introducing the MoneyGuide Financial Plan Summary Report
Tamarac now offers direct access to a dynamic version of MoneyGuide's Financial Plan Summary report to you and, optionally, to your clients to support you as client conversations shift to financial planning and goals. With this dynamic report, you can access a client's financial plan details to facilitate more holistic discussions. If desired, you can share the report with clients through the client portal to show how your firm helps them achieve their financial goals.
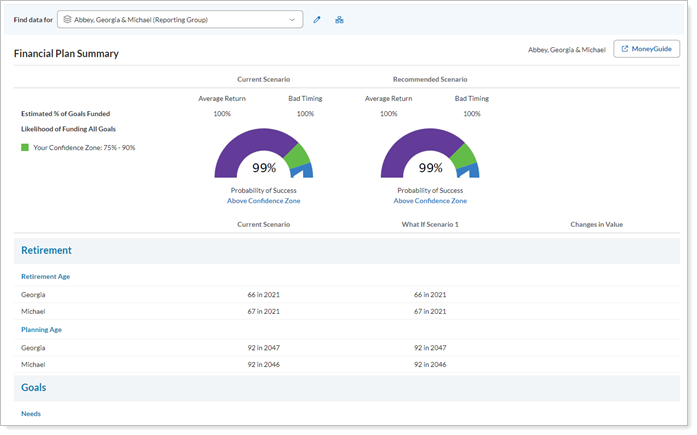
All firms that use the MoneyGuide integration automatically receive access to the Financial Summary report on the Reporting menu under Financial Planning Reports.
Note
The Financial Plan Summary report shows information for the primary Household and not for an account.
Auto-Refresh for the MoneyGuide Data
One way you can show your value to clients is by adding a MoneyGuide probability of success meter as a client portal dashboard tile, giving a visual representation of the client's financial plan progress. With this release, if data is more than 18 hours old, the Financial Plan Summary report and client portal MoneyGuide data points like the success meter automatically update, giving confidence that the meter reflects the most recent data.
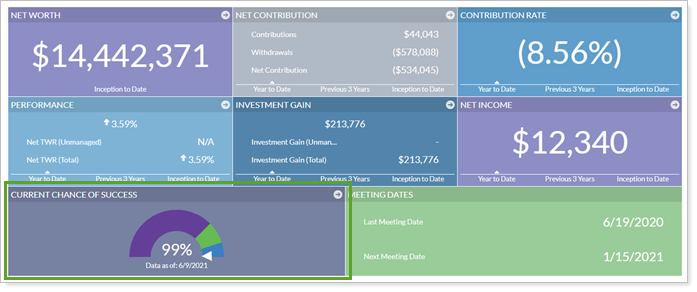
Pro tip: Use Hide Date to show or hide the most recent import date on a MoneyGuide chart tile.
Reporting
Market Charts Report Deprecated
The Market Charts report has been deprecated and is no longer available in Tamarac.
With this change, the Market Charts report has been automatically removed from all dashboards and client views. No additional action is required on your part, but you may want to review dashboards and client views that used the Market Charts report to see how they look.
New Manual Securities Data Point: Manual Security Yield
For those of you who use manual securities, you may have noticed that manual securities never had a way to add yield or equivalent for that holding. This could result in an incomplete picture of manual securities income. Now the new Dividend\Income\Rate\% field allows you to provide complete yield and income reporting for manual securities.
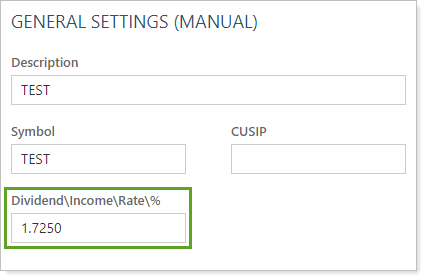
You'll also find this new data point, or calculations based on it, in bulk reports and uploads, the Holdings report in the Current Yield column, and on the Securities page in the Annual Income/Annual Dividend/Interest Rate column.
Reports Menu Items Reorganized
To make it easier to find reports, we've reorganized some of the items under the Reports menu. Now you'll find the Net Worth report, Relationship Diagram, and Financial Plan Summary report in the new Financial Planning Reports section.
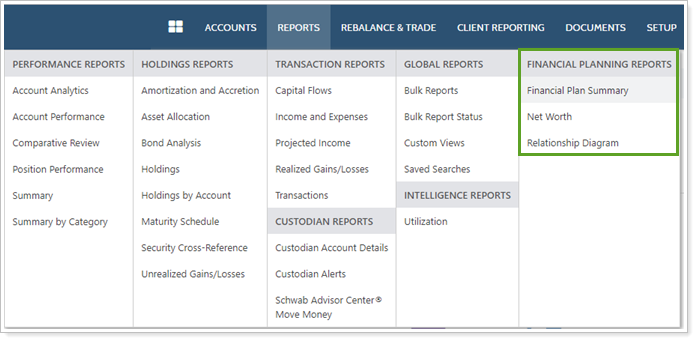
The exact contents of your Reports menu depends on your permissions and your firm's integrations.
Learn More - Watch the Release Video