
Contents
Select Your Own Category Colors
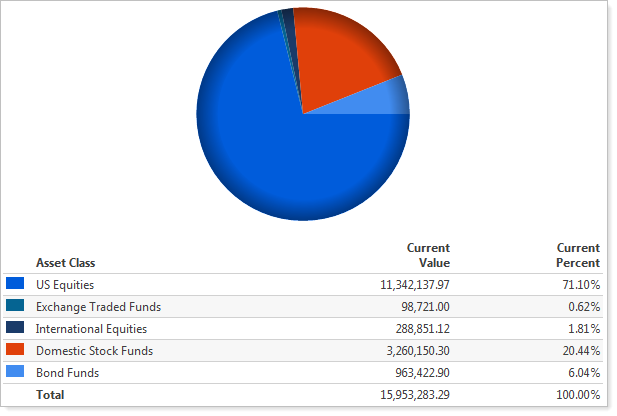
When viewing Advisor View PDF reports, sometimes it's confusing to visualize categories when the colors vary between reports - for example, green may represent bond funds on one report and commodities on another.
To make the visualization of categories easier, we're pleased to announce that you can now customize the category colors you'd like to display. With category colors, you can specify the report color for each asset class, security type, sector, and subsector. The colors you specify will be shared amongst your dynamic and PDF reports, creating a consistent look and feel for all reports and portal sites.
To set the report color for your categories, follow these steps:
-
On the Setup menu, click Categories.
-
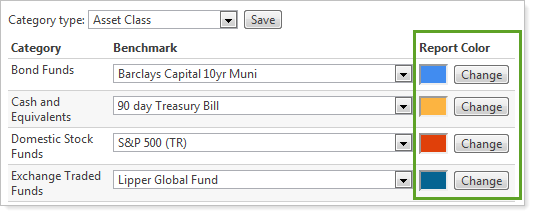
In the Category type list, choose the category where you want to specify a report color.
-
Under Report Color, click Change. In the color picker, click a color for the category.
-
When finished assigning report colors, click Save.
Tip
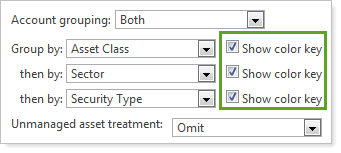
In the Holdings, Position Performance, and Account Performance PDF report sections, you can include the category color next to a category for reports without pie charts.
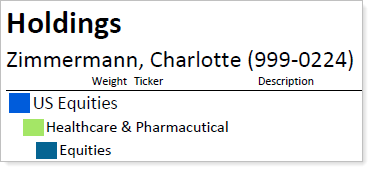
To add the category color, in the applicable section of the PDF report, select the Show color key check box.
End of Support for Internet Explorer® 7
Tamarac has greatly enhanced its products over the past six years. Unfortunately, Internet Explorer 7 has trouble running our new features effectively. As the complexity of our suite of products grows, we want to be sure that you can run the newest features that we release and that you have the best possible experience using our products.
With this release, we have discontinued support for Internet Explorer 7. If you or any of your clients are using Internet Explorer 7, you may find that major areas of Advisor View and your client portals will no longer work properly.
We are committed to continually improving the products and services we offer, and we want our valued clients to get the most out of the new functionality we are developing. Please take the time to upgrade your business to Internet Explorer 8 or Internet Explorer 9 and ask your clients to do the same.
Microsoft Internet Explorer 8 (recommended for Windows XP)
Microsoft Internet Explorer 9 (recommended for Windows Vista or higher)
If you have any questions, please do not hesitate to contact Client Services at 866.525.8811.
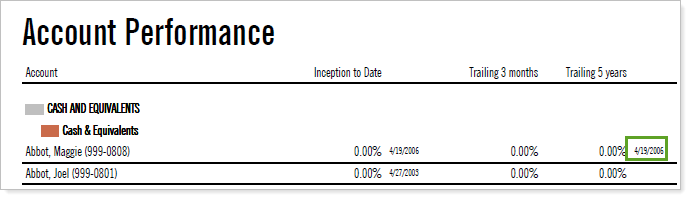
Control the Display of Partial Period Returns
When calculating returns on the Account Performance report, there are times when the calculated return is not based on the entire period shown on the report. For example, the account inception date was in the middle of the return period reported, or when reporting on securities, the security was purchased within the return time period. In these scenarios, many of you wanted a way to identify the accounts and securities.
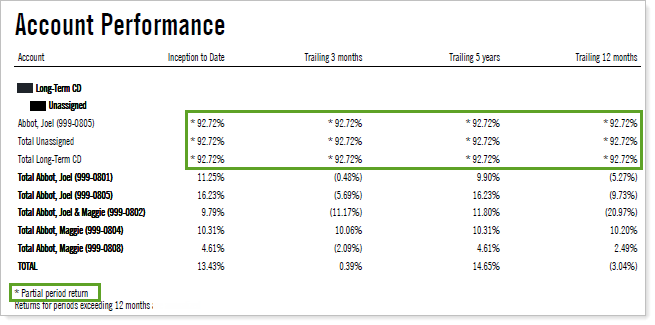
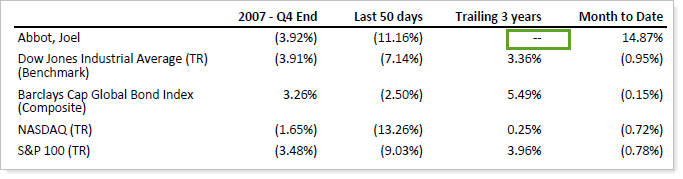
With this release, you have more control over the display of partial period returns. You now have the option of identifying the partial period return with one of the following:
-
The actual return start date.
-
A partial period return footnote.
-
Two dashes instead of the partial period return. This display option can also be combined with showing the actual return start date of the account or the security as demonstrated in the first example.
To configure the display of partial period returns on the Account Performance section of your PDF templates, follow these steps:
-
On the PDF Templates menu, click Templates.
-
In the Select a template list, choose the PDF template you want to modify. If you haven't created a PDF template, choose Create new template.
-
In the Add a section list, click Account Performance, and then click Add.
-
Under Bar Chart, in the Partial Returns list, choose how you want partial returns to display. Your choices are:
Do not mark.Displays the return with no indication that the return is not based on the entire return time period.
Mark with footnote.Displays an asterisk next to the return with a footnote at the end of the PDF section.
Mark with dashes.Displays two dashes whenever a partial period return applies.
-
If you want to include the actual return start date in the footnote, select the Include actual return start date in footnote check box.
- Click Save.
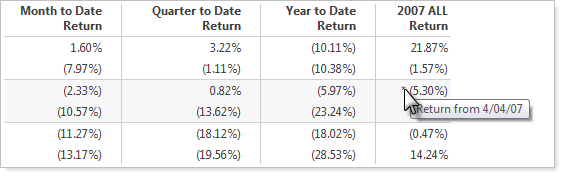
NOTE
When you view the dynamic Account Performance report, an asterisk will appear next to partial return periods. To see the actual return period, rest your mouse pointer over the asterisk, as shown below.
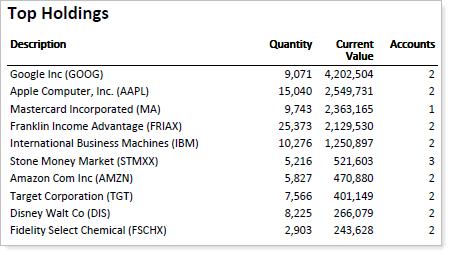
View Top Holdings on the PDF Dashboard Section
Many of you wanted a quick way to view the top holdings for an account in the Dashboard section of your PDF reports. With this release, you can add the top 10 or 25 holdings for an account to the Dashboard section of your PDF reports.
To add top holdings to the dashboard, follow these steps:
-
On the PDF Templates menu, click Templates.
-
In the Select a template list, choose the PDF template you want to modify. If you haven't created a PDF template, choose Create new template.
-
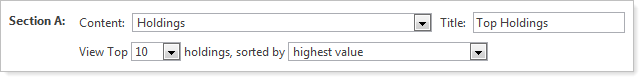
In the Add a section list, click Dashboard, and then click Add.
-
In the Content list for Section A, Section B, Section C, or Section D, click Holdings.
-
Click Save.
Customize the Columns on the Accounts Page
When you visit the Accounts page in Advisor View, you'll see that you now have the option to customize the columns that appear on the page for advisors as well as clients. You also have the ability to explicitly define if closed accounts should be included and how they will appear on the page.
In addition, you can now create views of the Accounts page in the same way that you can create views of a report. This makes it easy to switch between viewing different account data.
Customize the Columns on the Accounts Page for Advisors
To customize the columns on the Advisor View Accounts page, follow these steps:
-
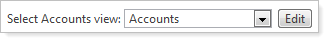
Click Accounts.
-
Click Edit.
-
Choose the columns you want to appear on the page:
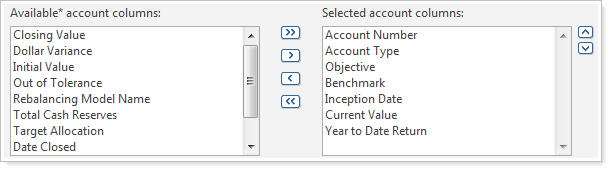
To add a column to the report, in the Available account columns box, click the column you want to add and then click >.
To remove a column from the report, in the Selected account columns box, click the column you want to remove and then click <.
To add all available columns to the report, click >>.
To remove all columns from the report, click <<.
Use the˄ and ˅ buttons to arrange the columns.
-
If you added the Percent Variance column, select the Include unmanaged assets in variance check box if you want to include unmanaged assets in the column.
-
In the Show closed accounts list, choose how Advisor View should display closed accounts. Your choices are:
Only as members of group
Always
Never
-
If you want to save the view, type a name for the view in the Report name box.
-
Click Apply.
NOTES
-
If you add multiple columns to the page, use the horizontal scroll bar to view the additional columns.
-
Account Name is a required column.
Customize the Columns on the Accounts Page for Clients
By customizing the columns that appear on the Accounts page of the client portal, you can show or hide specific account information. To do this, follow these steps:
-
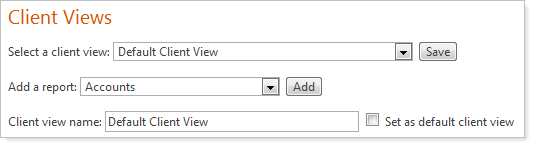
On the Setup menu, click Client Views.
-
In the Select a client view list, choose an existing client view. If you have not created a view, choose Create new client view.
-
In the Add a report list, click Accounts and then click Add.
-
Choose the columns you want to appear on the page:
-
To add a column to the report, in the Available account columns box, click the column you want to add and then click >.
-
To remove a column from the report, in the Selected account columns box, click the column you want to remove and then click <.
-
To add all available columns to the report, click >>.
-
To remove all columns from the report, click <<.
-
Use the ˄ and ˅ buttons to arrange the columns.
-
-
If you added the Percent Variance column, select the Include unmanaged assets in variance check box if you want to include unmanaged assets in the column.
-
In the Show closed accounts list, choose how you want Advisor View to present closed accounts.
-
Click Save.
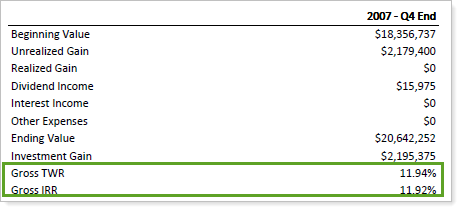
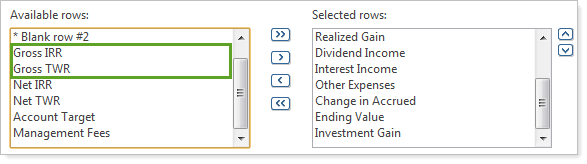
View Returns as Gross IRR or Gross TWR in the Summary Section of the Dashboard PDF Template
With this release, you can view the internal rate of return and the time-weighted return in the Summary section of the Dashboard PDF template. Before this release, only net IRR and net TWR were available options.
To add these columns, follow these steps:
-
On the PDF Templates menu, click Templates.
-
In the Select a template list, choose the PDF template you want to modify. If you haven't created a PDF template, choose Create new template.
-
In the Add a section list, click Dashboard and then click Add.
-
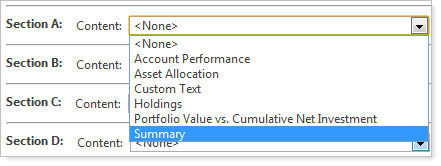
In the Content list for Section A, Section B, Section C, or Section D, click Summary.
-
In the Available rows box, click Gross IRR or Gross TWR and then click
 .
.
-
Click Save.
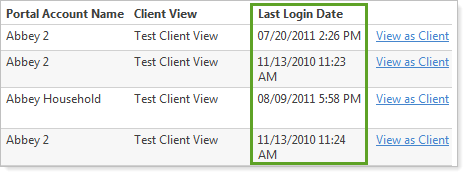
Quickly Find the Last Time a Client Logged Into the Client Portal
Have you ever wanted to see the last time one of your clients logged into the Advisor View client portal? Now you can.
To see the last time a user logged into the Advisor View client portal, click the Clients menu. The date and time appear in the Last Login Date column.
Document Assembly
With document assembly, you can bundle one or more client-specific documents with your PDF reports.
For example, let's say that you want to send a personalized quarterly newsletter to each of your clients in addition to a quarterly report and invoice. Instead of creating a complex mail procedure, you can simply upload a single zipped file of all your newsletters and each letter will be added to the correct client's PDF report.
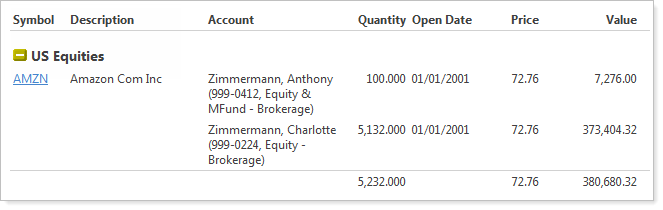
View the Holdings Report With Lot-Level Detail
When you view the Holdings report, you can now see the lot-level detail. In addition, you can also add the open date to the report.
Add Lot-Level Detail and the Open Date to the Dynamic Holdings Report
To add lot-level detail and the open date to the dynamic Holdings report, follow these steps:
-
On the Reports menu, click Holdings.
-
Click Edit.
-
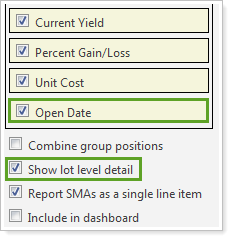
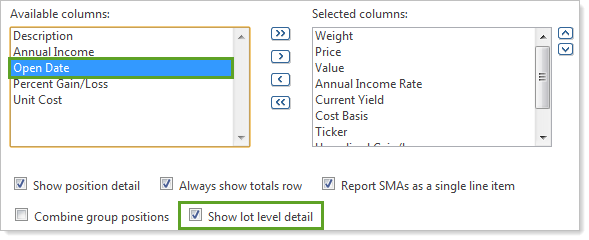
In the expanded area, select the Show lot-level detail check box. After you select this check box, a new column appears for Open Date.
-
To add an open date column to the Holdings report, select the Open Date check box.
-
Click Apply .
Add Lot-Level Detail and the Open Date to the Holdings Report PDF Template
To add lot-level detail and the open date to the Holdings report PDF template, follow these steps:
-
On the PDF Templates menu, click Templates.
-
In the Select a template list, choose the PDF template you want to modify. If you haven't created a PDF template, choose Create new template.
-
In the Add a section list, click Holdings and then click Add.
-
In the Holdings section, select the Show lot-level detail check box. If this check box is unavailable, clear the Combine group positions check box and then try again.
-
To add an open date column to the Holdings report, click Open Date in the Available columns box, and then click
.
-
Click Save.
Exclude Non-Taxable Accounts From the Income and Expenses Report
Many of you asked for a way to exclude non-taxable accounts from the Income and Expenses report. We've listened to your requests, and we're pleased to announce that you now have the option to include or exclude non-taxable accounts from the Income and Expenses report.
Exclude Non-Taxable Accounts From the Dynamic Income and Expenses Report
To exclude non-taxable accounts from the Income and Expenses report, follow these steps:
-
On the Reports menu, click Income and Expenses.
-
Click Edit.
-
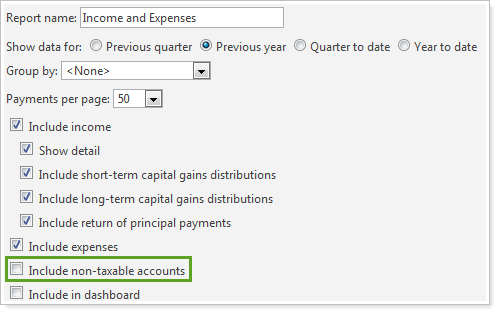
In the expanded area, clear the Include non-taxable accounts check box.
-
Click Apply.
Exclude Non-Taxable Accounts From the Income and Expenses Report PDF Template
To exclude non-taxable accounts from the Income and Expenses report PDF template, follow these steps:
-
On the PDF Templates menu, click Templates.
-
In the Select a template list, choose the PDF template you want to modify. If you haven't created a PDF template, choose Create new template.
-
In the Add a section list, click Income and Expenses and then click Add.
-
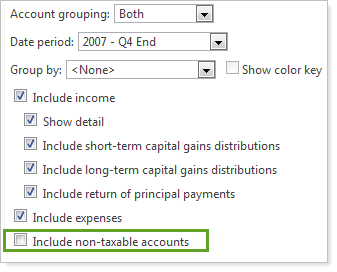
In the Income and Expenses section, clear the Include non-taxable accounts check box.
-
Click Save.