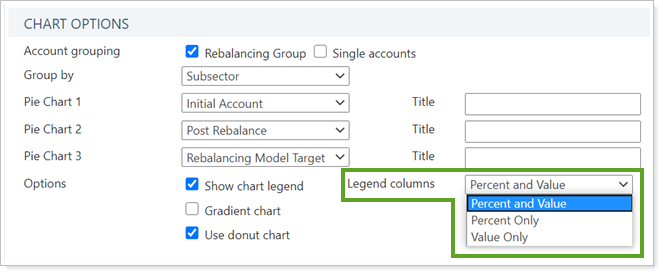
Legend columns lets you control the data points shown on the pie charts of the Rebalance Summary Charts PDF report.
This setting works in conjunction with Group by, where you can decide which category will be shown on the pie chart and Show chart legend, which can show or hide the chart legend. Legend columns dictates which data points will show.

These are your options:
-
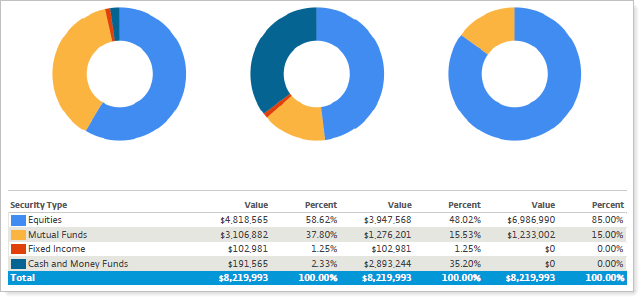
Percent and Value.Shows both the value and the percent value of the category shown.

-
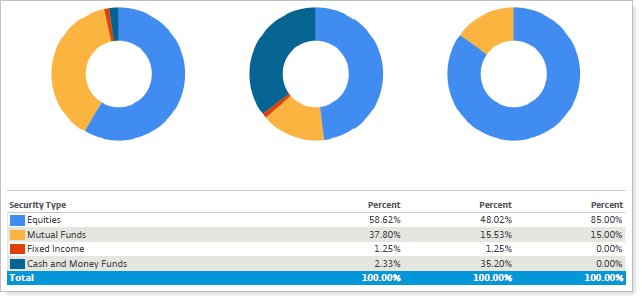
Percent Only.Shows the percent value of the category shown.

-
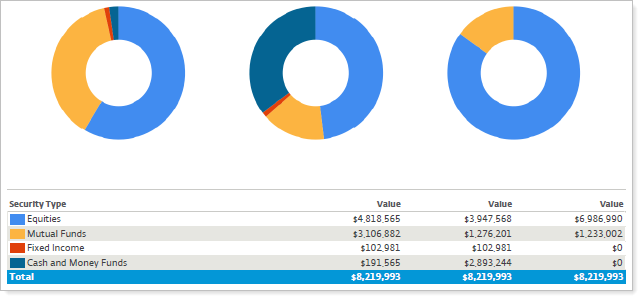
Value Only.Shows the value of the category shown.

