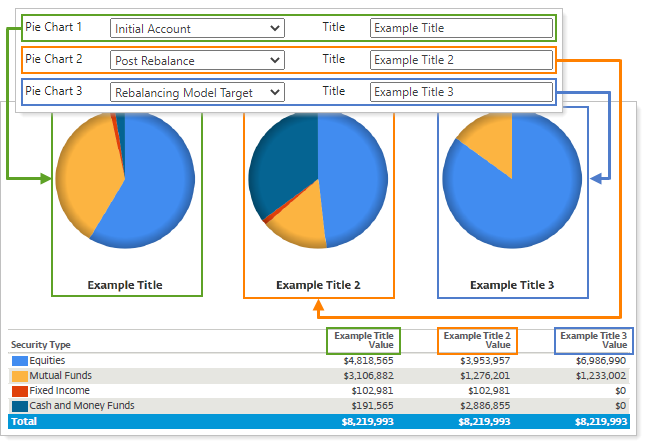
The Pie Chart 1, Pie Chart 2, and Pie Chart 3 settings control three available pie charts n the Rebalance Summary Charts PDF report by letting you choose what kind of data you want to show for that pie chart. With three available pie charts, you can compare data side by side.

For the Pie Chart settings, you can choose which data option you want to show:
-
Initial Account: Shows the data breakdown of holdings in the initial account, grouped by whatever category you choose in Group by.
-
Post Rebalance: Shows the data breakdown of holdings after the recommenced trades in a rebalance, grouped by whatever category you choose in Group by.
-
Rebalancing Model Target: Shows the data breakdown of the holdings as targeted in the model, grouped by whatever category you choose in Group by.
In addition, Title allows you to caption what you want to call that pie chart.

