
Contents
|
Include only securities held at the end of the period on the Account Performance report Include MoneyGuide Wealth Studios data in the Net Worth page and widget |
Client Portal
Include only securities held at the end of the period on the Account Performance report
What's changing
As an advisor, you need to present account performance with precision and clarity. With this release, the client portal gives you a cleaner way to present account performance by letting you configure the Account Performance report to show only securities held at the end of the reporting period. This focused view hides closed positions from the report display while still including them in performance calculations.
Why you'd use it
Use this option to present account performance more clearly and concisely. Showing only positions held at the end of the reporting period reduces noise from closed positions and historical trades while aligning the report with your firm’s performance standards.
How to get started
To enable this feature, in the Configuration tool, open the report template settings for the Account Performance report template you want to edit. Select Only show securities held at the end of the period.
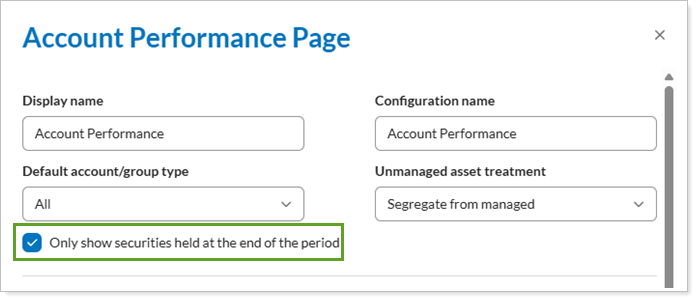
After saving your changes, the updated filter applies to Account Performance report in the client portal. Clients will see the change next time they sign in to the client portal.
Additional information
For more information, see Customize New Client Portal Pages and Reports.
Include MoneyGuide Wealth Studios data in the Net Worth page and widget
What's changing
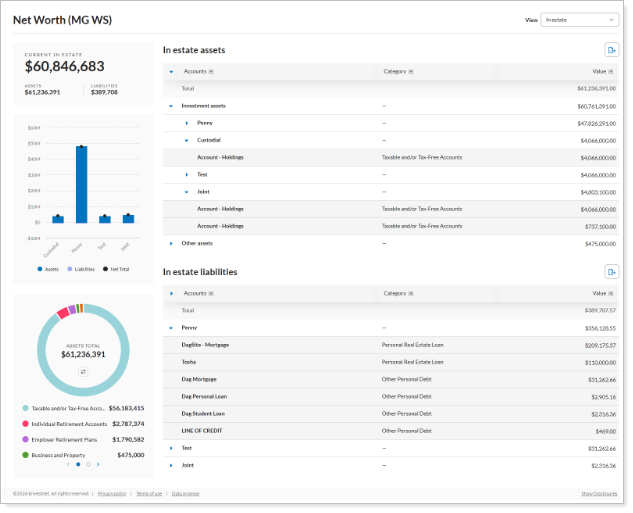
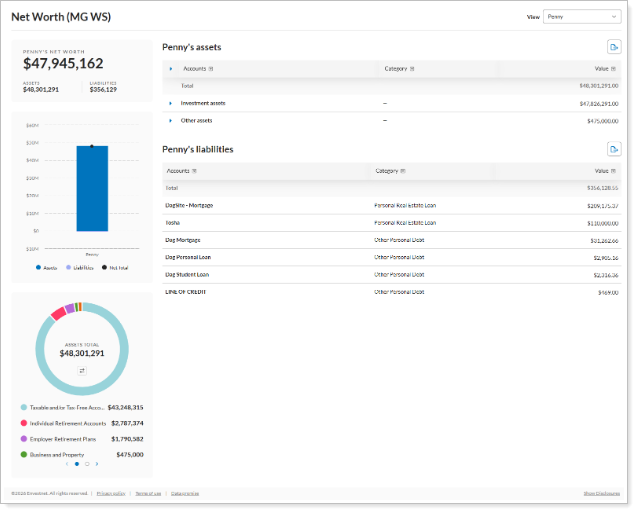
The Client Portal now supports MoneyGuide Wealth Studios as a data source for Net Worth pages and widgets. This integration combines Tamarac platform data with MoneyGuide planning insights, giving clients a more comprehensive view of their financial picture directly in the Client Portal.
-
Expanded data sources. Depending on your firm’s MoneyGuide integration settings, you can choose to source data from the standard reporting platform, MoneyGuide, or MoneyGuide Wealth Studios for your Net Worth displays.
-
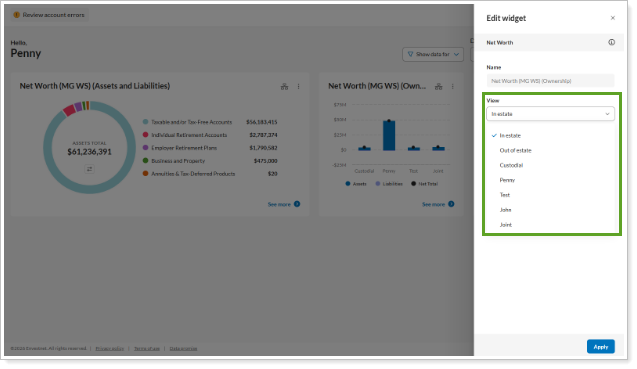
Advanced ownership views. Access a new View dropdown on the Net Worth page when using Wealth Studios data, featuring options for In estate, Out of estate, and individual owner names. This allows you to view your assets and liabilities in these groupings helps clients better understand where their money sits in their larger financial picture.
-
Dynamic widget linking. Configure Net Worth and Success widgets to link directly to Wealth Studios-based pages for a consistent user journey.
Why you'd use it
Use this integration to give investors a more complete financial picture by combining Tamarac platform data with MoneyGuide planning insights. You can tailor the client portal experience by selecting the data source that best fits each client’s financial situation.
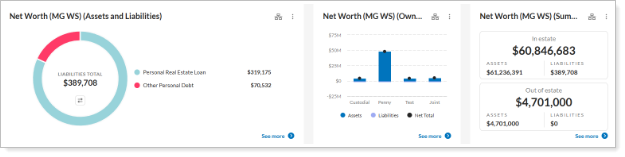
For example, use the In estate and Out of estate views to help clients visualize complex ownership structures and track estate planning progress directly from their dashboard.
In estate view
Out of estate view
How to get started
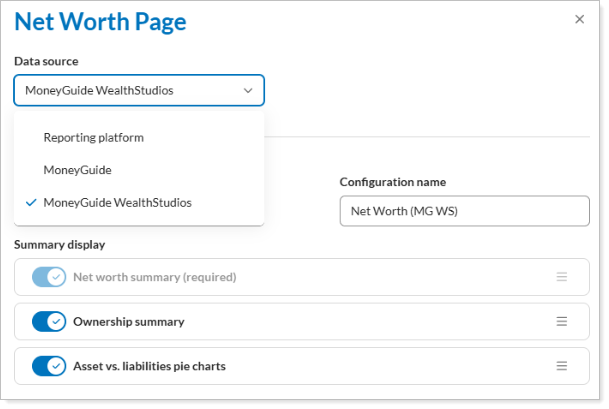
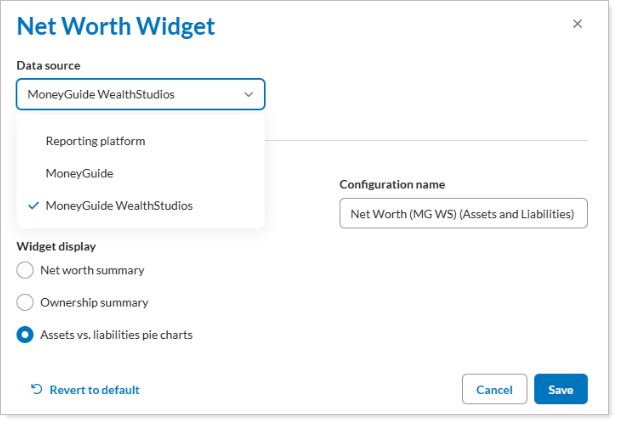
To enable this integration, open the Configuration tool and select the Net Worth page or widget. In Data source, select MoneyGuide Wealth Studios.
Notes
Your firm must have the appropriate permissions in Tamarac to access Wealth Studios features
Additional information
For more information, see Use MoneyGuide Data in Tamarac.
See benchmark data in the new Index Performance widget
What's changing
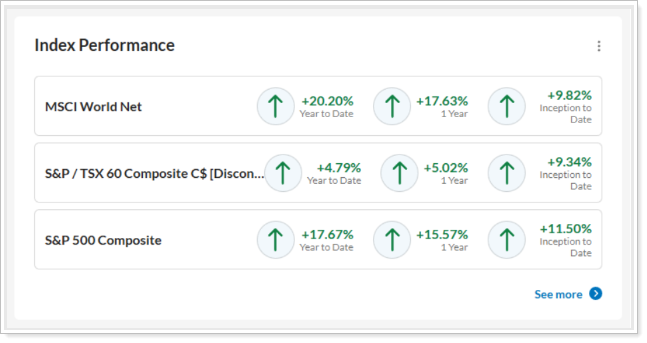
To save clients time, you can now allow them to monitor market performance without leaving the portal. Include the new Index Performance widget in client portals to give your clients quicker access to key benchmark data in a compact, streamlined view. The widget uses the same data sources as the full Index Performance report to ensure accuracy.
This enhancement includes:
This enhancement includes the following:
-
Display multiple indexes. Choose up to three specific indexes to display in the widget.
-
Compare multiple date periods. Select up to three date periods to compare performance across different timeframes.
-
Streamlined layout. View index names on the left and corresponding performance values on the right for a clear, data-focused experience.
Why you'd use it
Use this widget to keep important market benchmarks visible to clients, without requiring them to open separate reports. Clients can quickly reference performance trends during client calls or account reviews. For example, configure dashboard templates with specific regional benchmarks, so clients have immediate access to relevant market data.
How to get started
For information about how to add widgets to your dashboard, see Customize New Client Portal Widgets.
Additional information
For more information, see Customize New Client Portal Widgets.