 Back
Back|
Back |
|
Category Returns (Performance History Report)
| Applies to: | ||
|---|---|---|
| Dynamic |
Client Portal |
|
When you add the Category Returns column to the Selected columns list in the Performance History report, you will have the option to add the categories you want to appear as columns on the report with the values reported in percentage. If you add Category Returns, you must then add at least one security type.
You might use this if you want to display category returns over the intervals covered by the report. The Performance History report can be effective for understanding and evaluating returns at a category level within an account, and this setting allows you to determine which categories are displayed.
This report is available for PDF reports only.
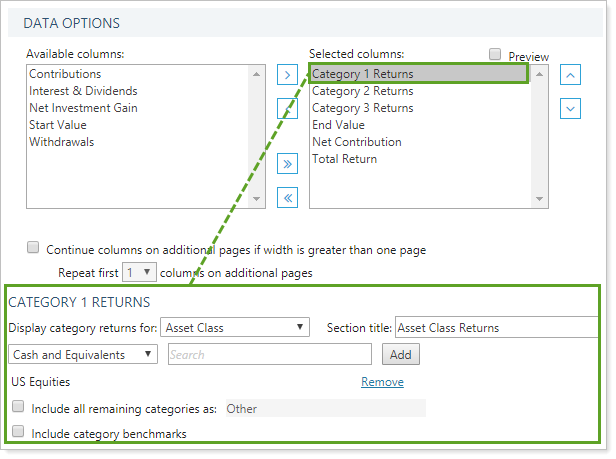
When you add the Category Returns column to the Selected columns list, the following settings appear. You can add up to three Category Returns columns, each of which has a corresponding settings section.
This setting lets you choose what category type you want to show returns for. You can choose from any of the categories established by your firm.
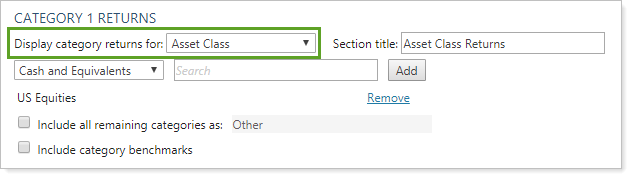
For more information about categories, see Security Categories.
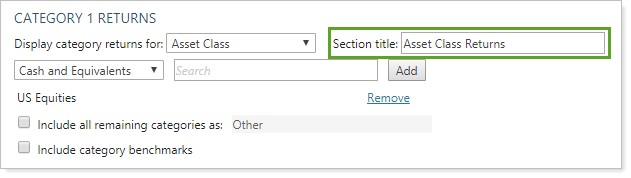
The Section title field allows you to customize the name of each category return column. To edit the name of a section, type the desired name in the appropriate field.
For example, when you leave Section title at the default, you see:
![]()
When you customize the Section title, you see:
For more information, see Section Title.
This list includes all the categories set for the category type selected. You can select directly from the list, or use the Search field to type in the name of the category. The list will filter to display only categories matching the search terms.
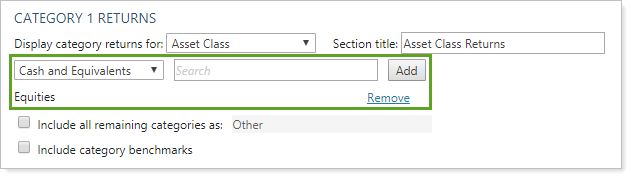
To add a category, click the category name in the list and then click Add. You can add multiple categories at once. Each category added will be displayed as a column on the report.
For example, Equities have been added as Category 1 Returns:
If you later want to delete a category you added, click Remove.
When you select some categories to add from the list, there may be some categories not selected for display. In this case, you can choose to either add a column to sum up any extra remaining category percentage, or not display those additional percentages.
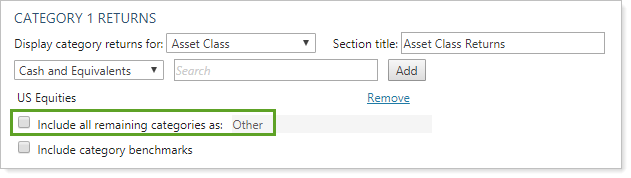
To show the remaining categories in one aggregated column, select the Include all remaining categories as check box. When you select this option, you can also rename the column.
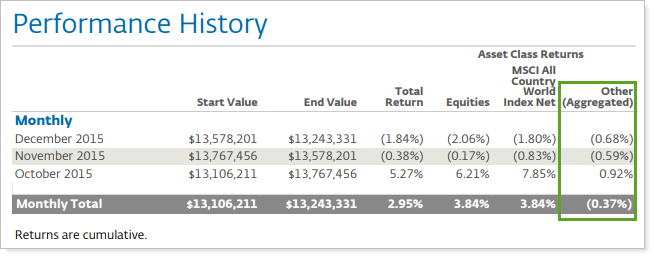
For example, when Include all remaining categories as is selected and the name is customized, you see the Other (Aggregate) column shows all the Other column data—the data for assets categorized into any category not displayed on the report:
To hide the remaining categories not added to the report, clear the Include all remaining categories as check box.
For example, when Include all remaining categories as is cleared, the report displays only values for the category included.
![]()
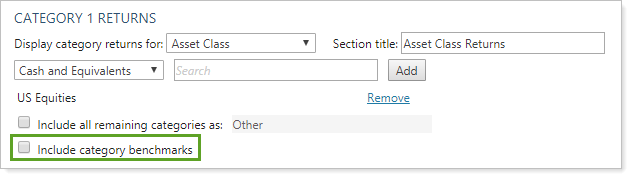
This setting allows you to show returns for category benchmarks alongside the categories themselves. For more information on adding benchmarks to categories, see Security Categories.
To show category benchmarks alongside the categories, select the Include category benchmarks check box.
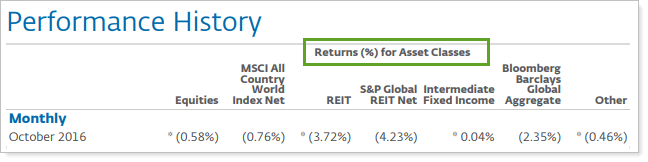
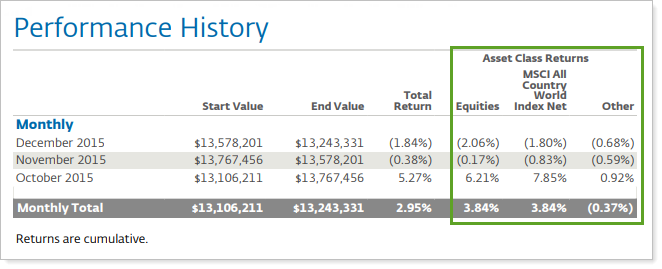
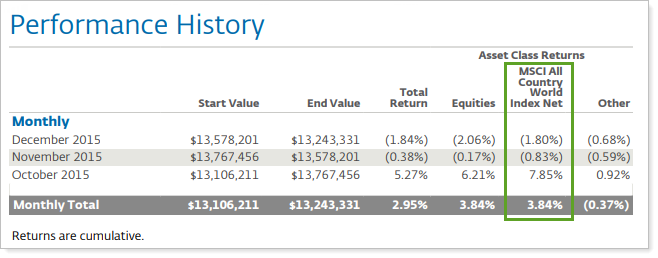
For example, a firm added MSCI All Country World Index Net as a benchmark for Equities asset class category. When Include category benchmark is selected, the report displays data for the benchmark alongside the category data.
To just show categories by themselves, without benchmarks, clear the Include category benchmarks check box.
For example, when you clear Include category benchmarks, the report does not display benchmarks for categories.
![]()
For more information about security categories, see Security Categories.