 Back
Back|
Back |
|
Performance History Report
| Applies to: | |||
|---|---|---|---|
| Dynamic | Mobile | Client Portal | |
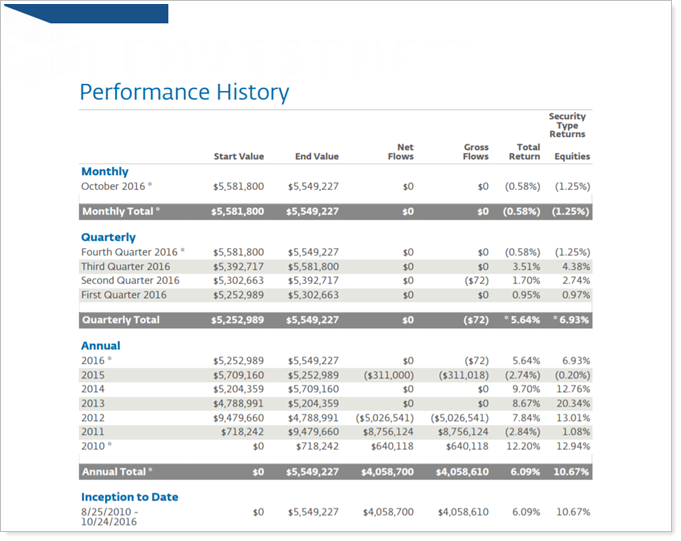
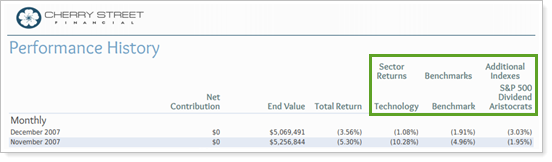
The Performance History report allows you to compare performance, particularly time-weighted return (TWR), for an account or group across multiple date periods, with an emphasis on sector-level returns for categories such as asset classes. It helps you understand how the time-weighted return was calculated by showing what returns were for smaller intervals within the period.
In addition to returns, the report includes some basic transaction and account value data points, as well as the option to add benchmarks and indexes, to provide context.
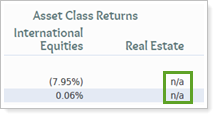
In PDF reports, lines that do not include data will be dropped from tables if you're using the enhanced performance calculations.
This report only includes managed assets.
In the Performance History report, you will find settings configurations that let you answer questions about performance for accounts, groups, and categories such as:
What returns did the account or group have over the period? Show returns for accounts or groups over the selected date periods, including monthly, quarterly, annually, inception to date, and custom date periods.
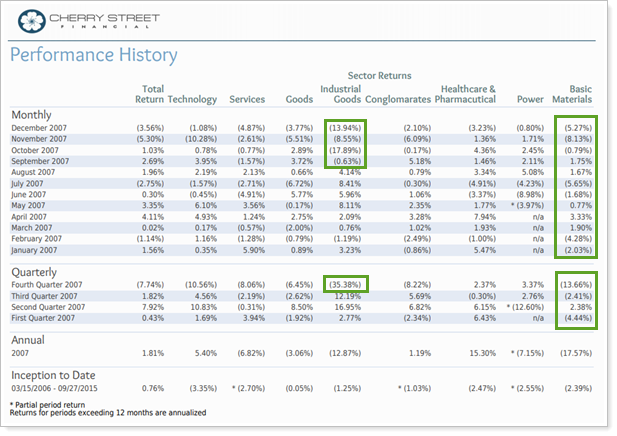
How did a specific category perform over the period? Narrow the focus to show sector-level returns for the selected date periods.
How Do Returns for an account or Sector Compare with benchmarks? Add benchmarks and indexes compare them side-by-side accounts, groups, or even sector performance.
Reviewing an Account Performance report, Advisor Kelly notices that the returns are lower than anticipated for the period, and Kelly can see that Industrial Goods and Basic Materials fared particularly poorly over that period.
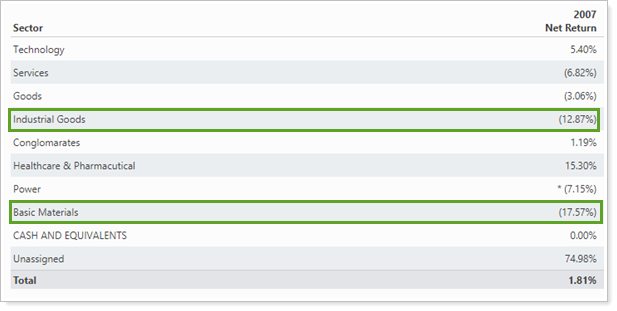
Kelly runs a Performance History report for the same period and adds the sectors held by that account. This allows Kelly to determine that, while the Industrial Goods sector took a hit in the fourth quarter, the Basic Materials sector consistently provided lower returns.
The Performance History report offers highly versatile settings that allow you to focus on how an account or group has performed.
This report displays managed, unmanaged, and total account value, flows, returns and more data points from the Summary report. For details and considerations about these data points, see Summary Report Data Point Calculations.
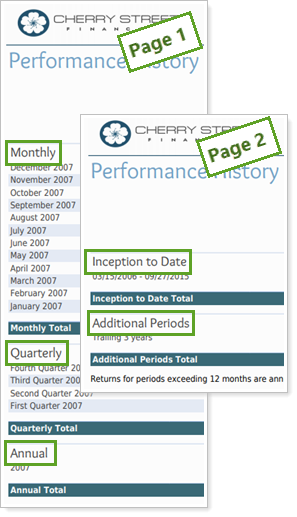
Choose to show or hide four standard date periods—monthly, quarterly, annually, and inception to date—or include up to 10 of your own custom date periods.
Add any of your firm's categories, benchmarks, or any available index for comparison with the account or group returns.
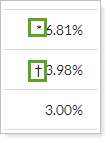
If you're using the enhanced performance calculations, you will be able to easily identify linked partial period TWR and other partial period returns on your reports. A dagger symbol (†) will indicate a linked partial period TWR and an asterisk (*) will indicate all other partial period returns (TWR and IRR).
Set how the report marks returns for accounts or groups with partial periods and, optionally, include the actual return date for partial periods.
If desired, override the PDF template theme's precision for just this section.
For more information about the difference between dynamic, interactive reports and PDF reports, see Introduction to Reports.
There is no Performance History dashboard widget available for the reporting dashboard because the report is only available as a PDF report.
The following settings are available for the Performance History report. Click the setting name for more details.
| Setting | Details | Available In... |
|---|---|---|
| PDF Report | ||
| Section Title | Designate what the section will be called in the PDF report. | X |
| Theme | Designate what theme the section will use. | X |
| Header and Footer | Choose a unique header and footer for the section or use defaults. | X |
| Include Page Break After This Section |
Control where page breaks occur in PDF reports. |
X |
| Account Grouping | Control grouping of accounts and groups. | X |
| Include Reports for Closed Accounts | Choose to show sections for accounts that were closed before the report As of Date. | X |
| Show Returns As Net or Gross |
Determine how returns should appear on the report. |
X |
| Include: Annualized Returns/Cumulative Returns |
Designate whether annualized returns, cumulative returns, or both are reported. |
X |
| Partial Returns |
Choose how to mark data points that have partial returns. |
X |
|
Mark the Date Period Title If All Returns for the Date Period Are Partial Returns |
Mark partial returns on the date period for the row or on the return itself. | X |
|
Select the check box and then set how the report marks missing returns. |
X | |
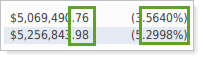
| Override Theme Dollar and Percentage Precision | Customize the number of decimal places reported in the Performance History report section | X |
| Dollar Amount Precision | Choose how many decimal places you want displayed for dollar values. | X |
| Percentage Amount Precision | Choose how many decimal places you want displayed for percentages. | X |
| Base Date Periods On | Set what year-end date is used for those calculations in the event that an account has a different fiscal year end from the rest of the group. | X |
| Show Monthly Intervals For | Set the date period you want to display monthly intervals for. | X |
| Show Quarterly Intervals For | Set the date period you want to display quarterly intervals for. | X |
| Show Annual Intervals For | Set the date period you want to display annual intervals for. | X |
| Show Inception to Date Summary |
Show or hide a summary of performance from inception. |
X |
| Show or hide any values that aren't specifically about performance returns. | X | |
| Include Additional Date Periods |
Add custom date periods to supplement the four standard report intervals. |
X |
| Date Period |
Select the date period you want to use for the report. Includes related settings: |
X |
| Use Inception Date | Report partial periods in PDF reports for instances where the account or group was opened after the beginning of the date period selected. | X |
| Continue Columns on Additional Pages if Width is Greater than One Page |
Roll over the extra columns onto the following pages. |
X |
| Repeat First X Columns On Additional Page | Designate how many columns from the first page are carried over onto following pages. | X |
| Add Benchmark |
Add one or more of the category or account benchmarks as a data point for comparison. |
X |
| Category Returns |
Includes related settings:
|
X |
| Include Benchmarks | Add the performance of one or more of the firm's custom benchmarks as a data point for comparison. | X |
| Available/Selected Indexes | Choose which indexes are included and in what order. | X |
| Preview | See a sample of the PDF report with the selected settings. | X |
To learn more about reports in Tamarac, see Introduction to Reports.
To learn more about how to generate a report, change the data displayed, print or export the report data, and more, see Basics of Working With Reports.
To learn more about creating and using PDF reports, see Understanding PDF Reports and Workflow: Generate a PDF Report.