
Contents
How Highlight Rows Outside Target Allocation Min/Max Works
| Applies to: | ||
|---|---|---|
| Dynamic |
Client Portal |
|
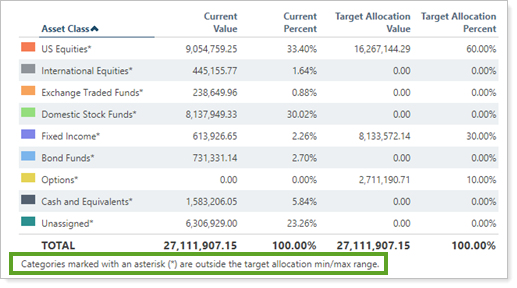
By default, when you show the target allocation pie chart and an accompanying chart legend, the legend table doesn't indicate which securities are out of range. This setting allows you to mark out-of-range securities on the chart legend with an asterisk.
In Dynamic Reports
This setting allows you to mark on the table all the categories that are outside the target allocation range.

In PDF Reports
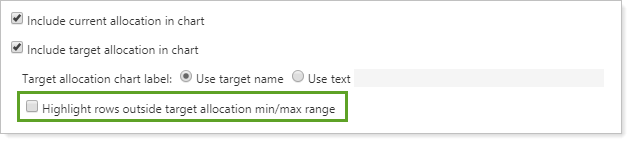
This setting is only available in PDF reports if you have already selected Show pie chart legend.
-
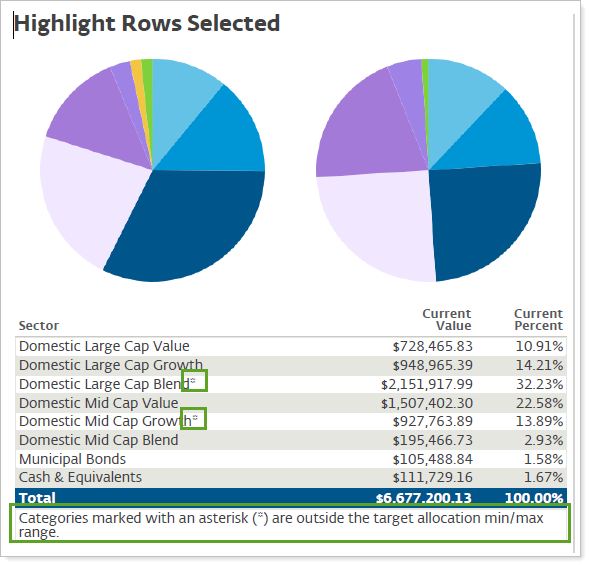
To add an asterisk next to securities outside of the target allocation range, select Highlight rows outside target allocation min/max range.
-
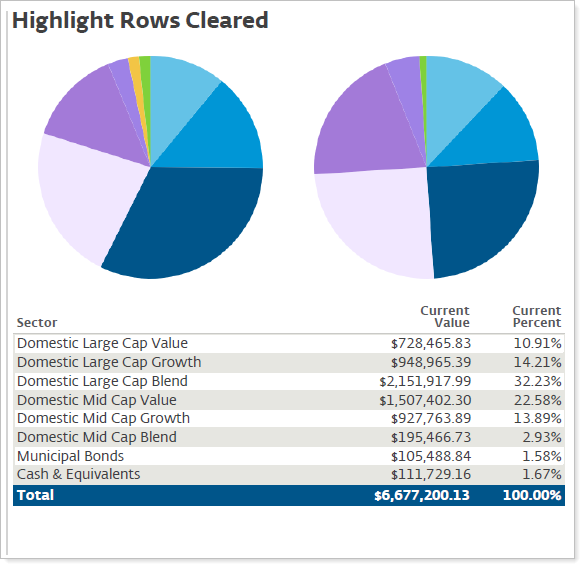
To not mark out-of-range securities specifically, clear Highlight rows outside target allocation min/max range.
Reports With This Setting
PDF-Specific ReportsHoldings Reports
-
Asset Allocation (PDF Dashboard only)
Related Settings
For more information on creating and using target allocations, see Target Allocations.
The following setting is related: