
Contents
How Show Ratings Pie Chart Works
| Applies to: | ||
|---|---|---|
| ✔ Dynamic |
✔ Client Portal |
|
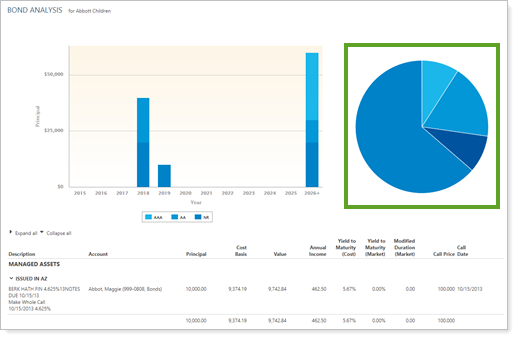
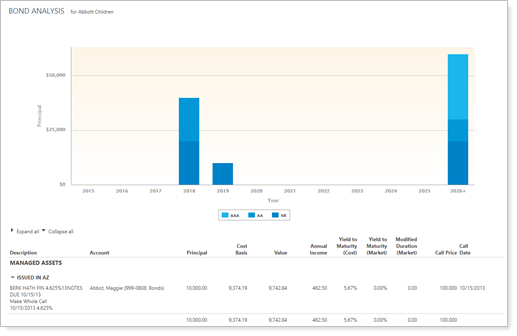
This setting allows you to show or hide a Bond Analysis pie chart that reflects the proportions of each rating appearing in the total bond portfolio. It also allows some customization of the chart.
You might choose to display a ratings pie chart with your Bond Analysis report for an at-a-glance visualization of the ratings within a portfolio.
In Dynamic Reports
You can choose:
-
Selected.
-
Cleared.
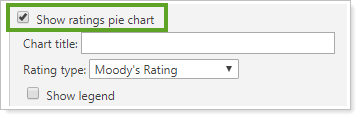
When you select the Show ratings pie chart check box on the Bond Analysis report, the following settings appear:
In PDF Reports
Functionality is the same in the PDF report templates as in dynamic reports. The full PDF report and the PDF Dashboard report both offer the following additional settings:
Reports With This Setting
Holdings ReportsRelated Settings
The following setting is related: