
Contents
|
How Show Maturity Ladder, Positions Table, Bar Chart, or Ratings Pie Chart Works |
How Show Maturity Ladder, Positions Table, Bar Chart, or Ratings Pie Chart Works
| Applies to: | ||
|---|---|---|
| Dynamic |
Client Portal |
|
When you add the Bond Analysis report to a PDF Dashboard report, you can choose to show any of four different types of bond-related information:
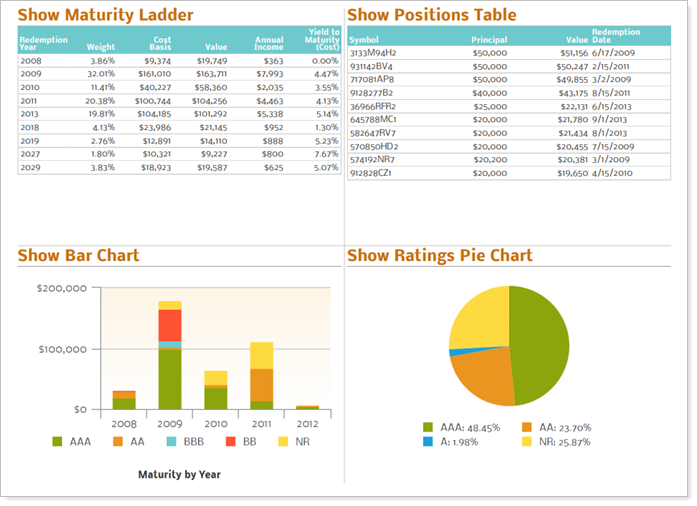
This setting allows you to select which bond analysis information is displayed in the PDF Dashboard report's panel and to configure the settings unique to that selection. Which one you choose, and how you configure its settings, depends on what you're trying to communicate with the PDF Dashboard report.
In Dynamic Reports
This setting is only available in the Bond Analysis section of the PDF Dashboard report.
In PDF Reports
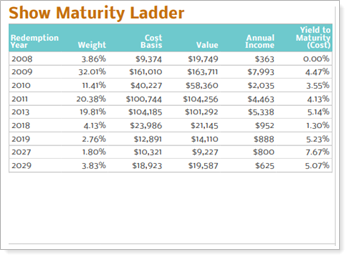
Show Maturity Ladder
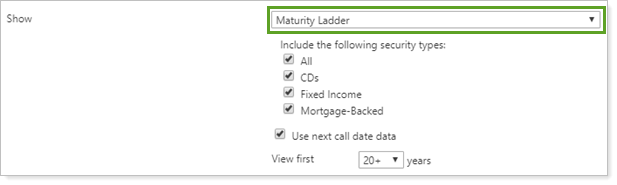
To add a maturity ladder to a PDF Dashboard report section, edit an individual section in the report and, in the Show list, select Maturity Ladder.
When you select Maturity Ladder, the following settings are available:
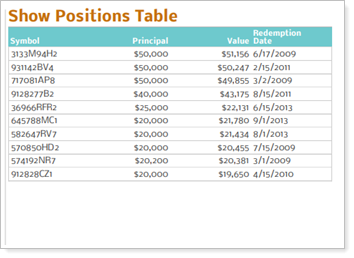
Show Positions Table
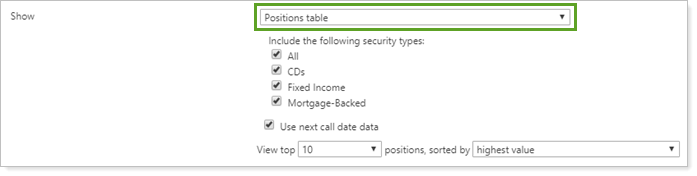
To add a positions table to a PDF Dashboard report section, edit an individual section in the report and, in the Show list, select Positions table.
When you select Positions table, the following settings are available:
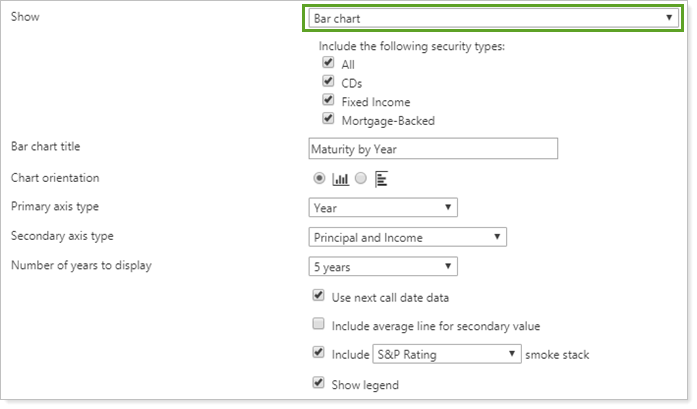
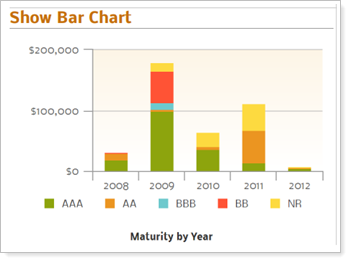
Show Bar Chart
To add a bar chart to a PDF Dashboard report section, edit an individual section in the report and, in the Show list, select Bar chart.
When you select Bar chart, the following settings are available:
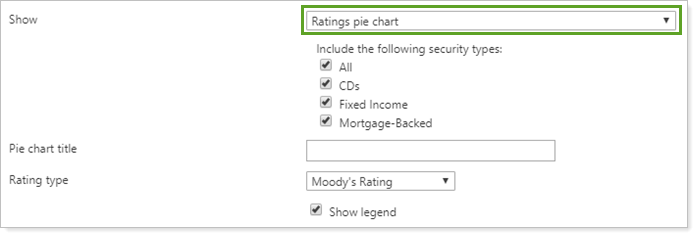
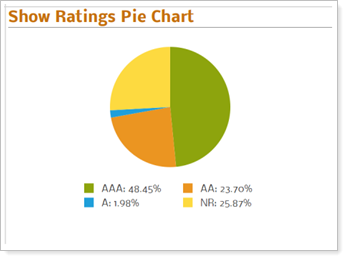
Show Ratings Pie Chart
To add a ratings pie chart to a PDF Dashboard report section, edit an individual section in the report and, in the Show list, select Ratings pie chart.
When you select Ratings pie chart, the following settings are available:
Reports With This Setting
PDF-Specific ReportsHoldings Reports
-
Bond Analysis (PDF Dashboard only)
Related Settings
The following setting is related: