Contents
|
Contribution and Average Weight |
Introduction
In simple terms, attribution analyzes the success of a particular position by showing how it compares to other positions, such as other positions in a portfolio or a benchmark.
In Tamarac, there are a few tools you can use for performance attribution analysis. This topic covers the currently available tools.
Contribution and Average Weight
The Position Performance report lets you view Contribution and Average Weight columns to examine attribution.

Contribution
Contribution tells you how much an individual investment contributed to the total portfolio by weight, and the interaction of weight and return is contribution. In simple terms, you can use Contribution to let you know if you have too much of a bad position or too little of a good position when comparing that position to the whole portfolio or portfolio category. This will tell how much a position is contributing to overall performance.
Contribution is calculated differentLY in TWR and IRR. For more detailed information on how those calculations are performed, see Contribution.
Average Weight
Average Weight describes how a position achieved a certain level of contribution. When used in conjunction with Contribution, you can compare how much a position contribute to the overall portfolio compared to how much of the portfolio is made up of that position. For example, you could see a position contribute to 25% of the portfolio's performance while only making up 2% of the portfolio, letting you know that position is a high contributor to overall performance. This can help you make future decisions about the positions you want to make up more or less of the overall portfolio.
For more detailed information on how Average Weight is calculated, see Average Weight.
See Performance Attribution in Reports
You can view performance attribution information in the following reports:
Position Performance Report
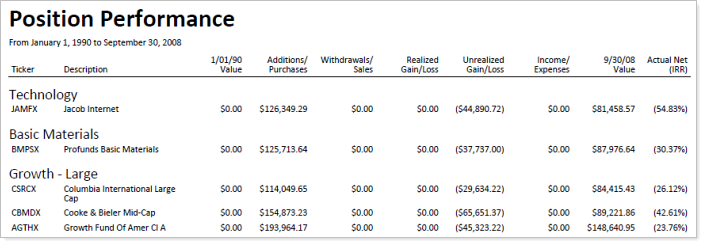
The Position Performance report aggregates performance, holdings, and transactions data to provide details about how an account or group achieved the reported returns. On the report, you can see a granular breakdown of returns, contribution, and average weight for specific securities or security categories alongside transaction data like inflows and outflows, income and expenses, and change in value of securities held and sold.

For more information, see Position Performance Report.
Performance Attribution Report
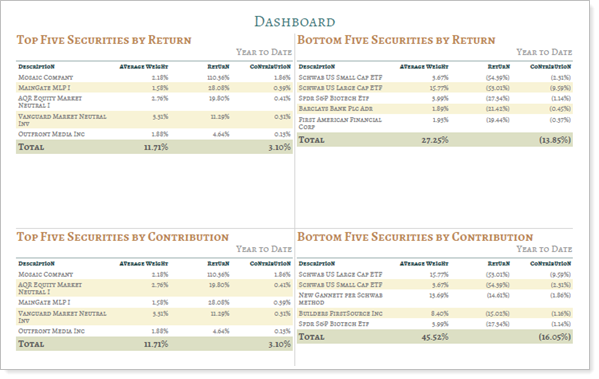
The Performance Attribution report lets you create a PDF report showing securities or security categories by return, contribution, and average weight. This allows you to see the top or bottom securities or security categories and evaluate how those securities contribute to performance. For example, you can show the top five contributing securities and use the Total row to see the combined contribution impact compared to the total portfolio.

The Performance Attribution report contains information available on the Position Performance report. The differences are:
| Position Performance Report | Performance Attribution Report |
|---|---|
| Comprehensive information about the portfolio. | Summary of top and bottom performers shows how securities contribute to overall performance |
| Dynamic and PDF report | PDF Dashboard section only. |
For more information, see the following:
