Contents
Account Analytics Report
With the Account Analytics report you can chart risk-adjusted comparisons to benchmarks and indexes for your client portfolios. You can customize reports with relative statistics and portfolio metrics to better manage risk-adjusted returns. Report options include standard deviation, Sharpe ratio, alpha and beta, upside/downside capture, information ratio, and more.
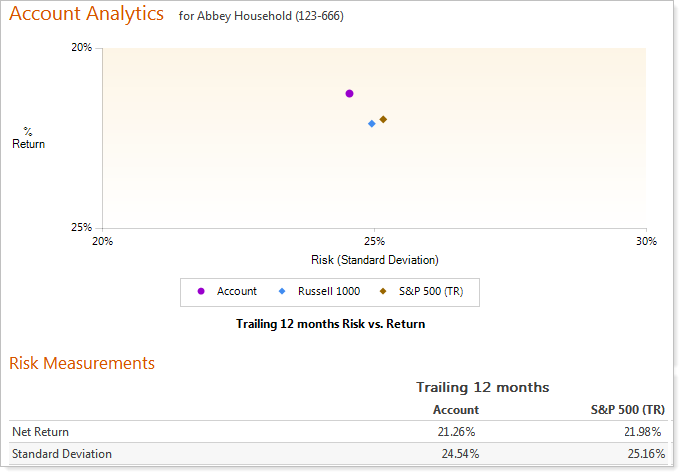
Capital Flows & Account Analytics Reports Added to PDF System Templates
In the July release of Advisor View, we added the Capital Flows report as an available section for PDF reports. In this release, we've added the Capital Flows and Account Analytics PDF sections to the system templates that our product experts have configured to demonstrate some best practices in report generation.

We've added the Capital Flows Dashboard section to the Comprehensive Portfolio Review and Summary templates, and we've added the Account Analytics section to the Performance Review template. The Dashboard section has been added to the Comprehensive Portfolio Review system template only.
As part of these updates, we've also introduced two new system themes with smaller fonts to allow you to include more information on your reports. These system themes are Ocean - Small and Envestnet | Tamarac - Small.
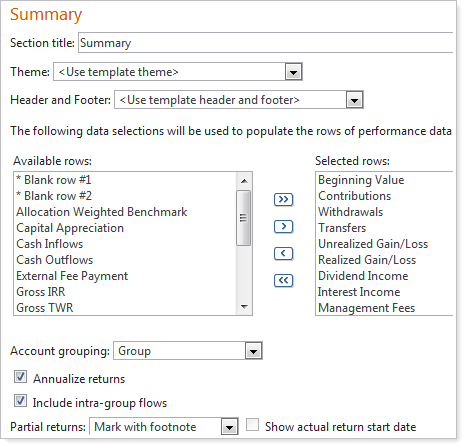
Include Intra-Group Flows on the Summary PDF Report
With this release, you can now include intra-group flows on the Summary PDF report.
An intra-group flow is recognized if the total group outflows match total group inflows for withdrawals and contributions.
Advisor View will not match transaction by transaction for contributions.
For receipts and transfers, the security, amount, and date must match to be considered as an intra-group transaction.
For example, if Tom Ace deposits and then withdraws $50 on the same day or if he transfers 10 shares of IBM and receives 10 shares of IBM, this will be considered an intra-group flow.
Example 1: Intra-Group Flow
Ace Household (Group)
-
Tom (Single) deposits $100 on 1/1/2012
-
Danette (Single) withdraws $100 on 1/1/2012
Example 2: not Recognized as an Intra-Group Flow
Ace Household (Group)
-
Tom (Single) deposits $100 on 1/1/2012
-
Danette (Single) withdraws $100 on 1/1/2012
-
Steven (Single) deposits $50 on 1/1/2012
To include intra-group flows on the Summary section of your PDF reports, simply select the Include intra-group flows check box.
View up to 20 Categories on the Asset Allocation PDF Dashboard Section
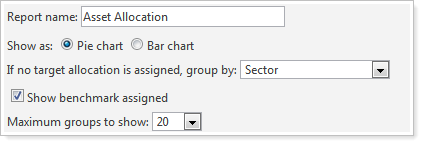
Some clients have asked to see more than the 10 maximum categories that were allowed on the Asset Allocation dashboard report. We've listened to your feedback, and with this release, Advisor View will now display a maximum of 20 categories on the report.
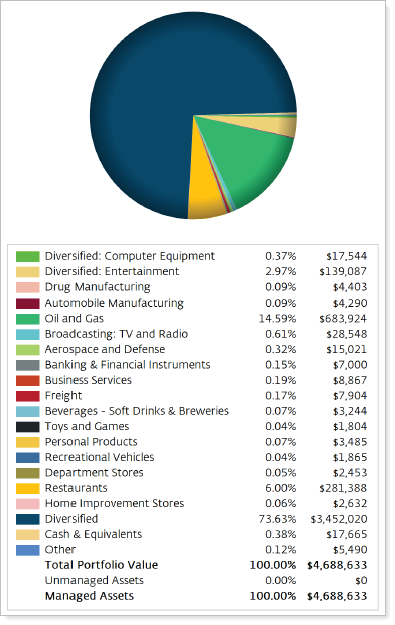
To take advantage of this new feature, your dashboard layout must have available space for the additional categories. If Advisor View does not have enough available space for the additional categories, only 10 categories will appear for the report section.
Show Category Benchmarks on the Asset Allocation Report
You now have the option to include category benchmarks on the Asset Allocation report.
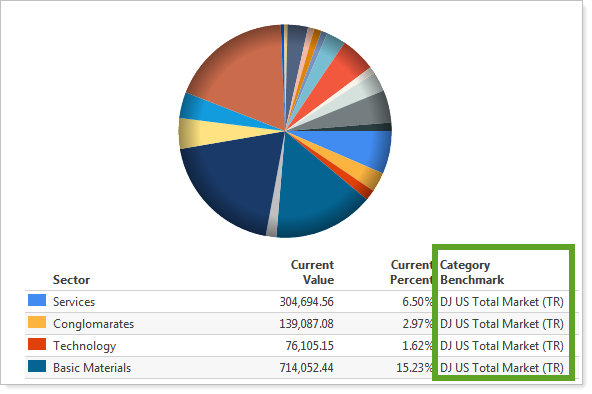
To check out this new feature, on the dynamic or PDF Asset Allocation report, select the Show benchmark assigned check box. Advisor View adds a Category Benchmark column to the report.
Account Performance Report—Additional Options for Graphs and Date Periods
Over the years, we've heard great feedback on the Account Performance report. One piece of feedback we've heard is that some of you want greater flexibility for the display of graphs and date periods.
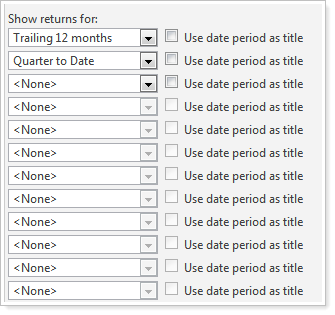
We're pleased to announce that we've added several new options to the dynamic and PDF Account Performance report - all aimed at providing flexibility for the appearance of graphs and date periods.
Some of the new features we've added include:
-
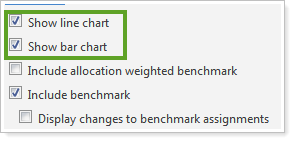
Show or hide the line chart and bar chart on the dynamic report
-
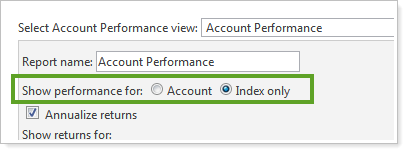
Report on index performance instead of account performance
-
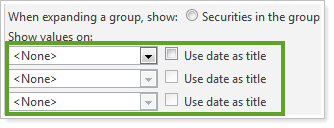
Omit a date period on the dynamic report for the account value
-
Show up to 12 time periods on the dynamic report

More Flexible Billing Module
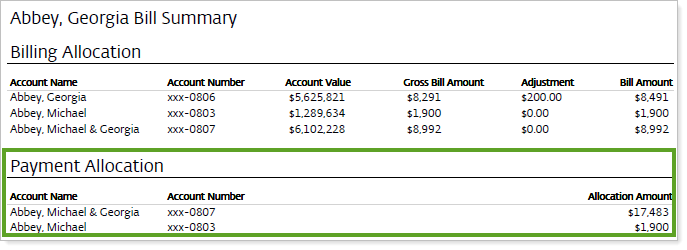
We've added some additional flexibility for prorating of capital flows. In addition, we've also made it easy to hide the Payment Allocation section of your billing statements.
Hide the Payment Allocation on Billing Statements
With this release, you can hide the Payment Allocation section on your billing statements.
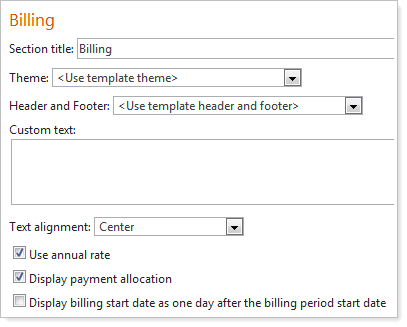
To hide the payment allocation on your billing statements, in the Billing section of your PDF template, clear the Display payment allocation check box.
Prorate Capital Flows as a Percentage of the Billing Group Value
Instead of prorating capital flows by a dollar amount, some clients wanted to prorate capital flows that are more than a particular percentage of the billing group value. We've listened to your requests and have added this functionality to the Advisor View billing module.

To take advantage of this new feature, on the Billing menu, click Billing Definitions. On the Prorations tab, specify the amount as a percentage of the billing group value.
Assign Unique Billing Definition to Each Account in a Billing Group
To assign a unique billing definition to an account in a billing group, follow these steps:
-
On the Billing menu, click Billing Groups.
-
Click Edit next to the billing group where you want to assign a unique billing definition to an underlying account in the group.
-
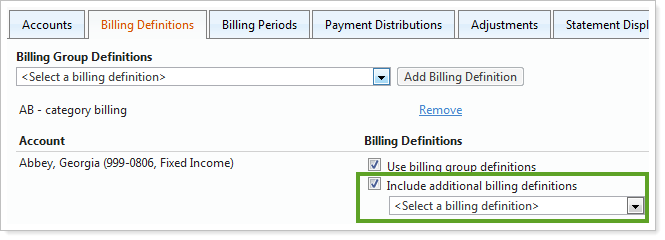
On the Billing Definitions tab, for the account where you want to assign the unique definition, select the Include additional billing definitions check box.
-
In the list of billing definitions, choose the appropriate billing definition and then click Add Billing Definition. You can add as many billing definitions as you want.
-
When finished, click Save.
View External Fee Payments on the Summary PDF Report
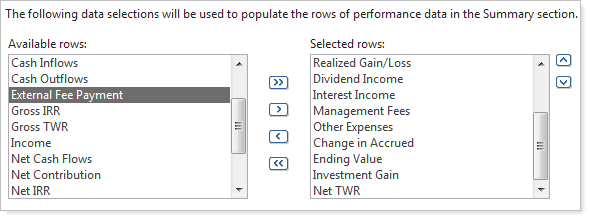
You can now view external fee payments in the Summary section of your PDF reports.
To take advantage of this new feature, follow these steps:
-
On the PDF Templates menu, click Templates.
-
In the Select a template list, choose the PDF template where you want to see external fee payments.
-
In the Summary section, under Available rows, click External Fee Payment and then click
 .
.
-
Click Save. Advisor View adds the row to the report.
