Contents
Tamarac Makeover Updates
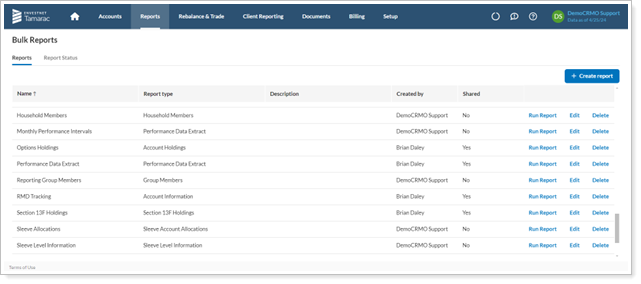
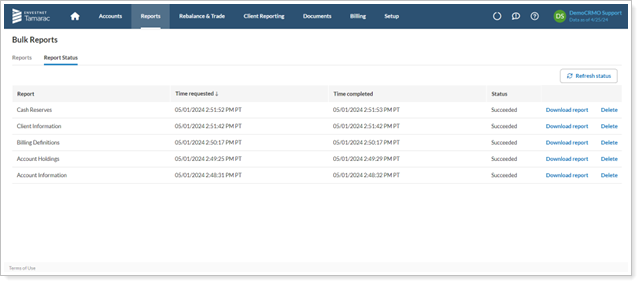
New UI For Bulk Reports, Bulk Report Status, and PDF Scheduler
We’re continuing to enhance the look and feel of Tamarac pages throughout the platform and recently updated the following areas:
-
Bulk Reports
-
Bulk Report Status
-
PDF Scheduler
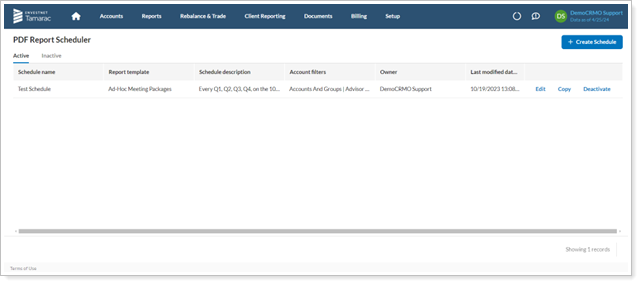
As always, the core functionality remains the same. The changes are focused on UI elements and aim to improve the user experience and visual consistency.
New Client Portal Mobile App
This release, we polish the mobile app to a high shine. Now it offers everything your clients need to make it their one-stop shop for financial results, including the ability to control some widget settings on the dashboard, seeing more on the widgets themselves, parity with the desktop client portal in reports available, and so much more.
The following enhancements bring the client portal mobile app up to the same level as the desktop app, offering everything clients need to know about their financial accounts. It solidifies the client portal mobile app as a best-in-class tool that will wow your clients.
Add Your Logo and Branding to the Client Portal Mobile App
When we first introduced the client portal mobile app, it offered a clean, unbranded, generic experience. We’re excited to offer the ability to create a fully branded mobile app experience for your clients. With this enhancement, the mobile app becomes fully your brand, with your logo appearing in the app store, sign-in screen, and loading page, as well as your own terms of use, privacy policy, and data promise.
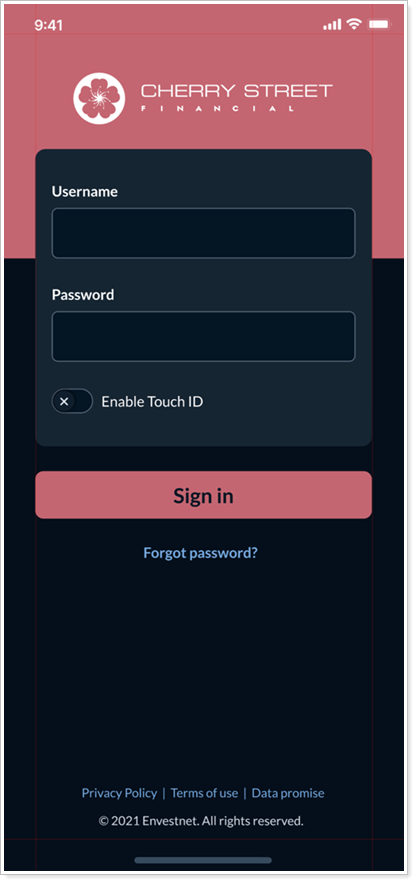
Clients know and trust your brand. This enhancement strengthens clients’ trust in the mobile app and strengthens your brand by allowing you to put your name on the strongest mobile app on the market. It’s the final piece you’ve been waiting for to move your clients onto the new mobile app and start them on their Intelligent Financial Life™.
To access the branded mobile app configuration, firms that use Tamarac Reporting should contact Account Management to amend their contract.
For more information, see Workflow: Create a Branded Mobile App.
Edit Data Source and Date for Widgets
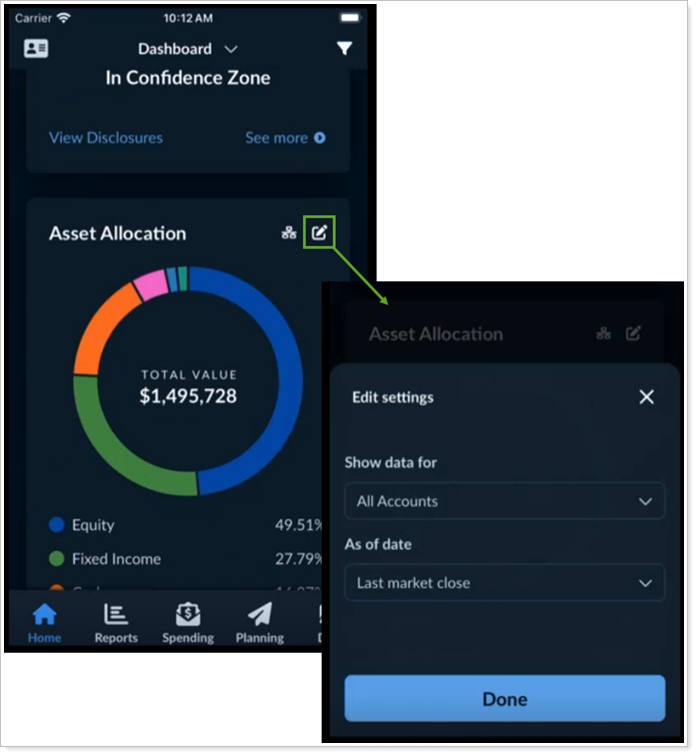
Previously, mobile app widgets showed the date and account selected on the desktop dashboard. Now, clients can set the data source and date or date period for each widget in the mobile app.
How long do these changes stick around?
Data and date selections vary depending on who created the dashboard:
If the client created the dashboard, any changes made in the mobile app also appear next time clients sign in to the mobile or desktop app.
If you, the advisor, created the dashboard, it will revert to your settings next time clients sign in.
Reorganized and Expanded Tile Content
With this release, we made changes to tiles in the following pages:
-
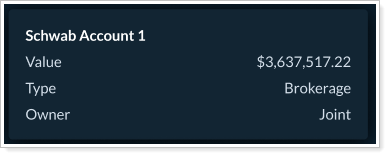
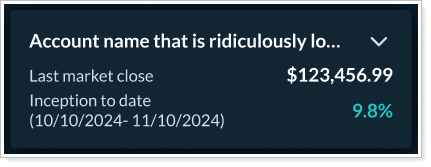
Net worth: To make it easier to read long account names, we’ve slightly reorganized how the Net Worth tile presents data so that an account name alone occupies the first line.
-
Account Performance: If the Account Performance widget in the Reports template includes a chart, clients will now see that chart on the dashboard widget in the mobile app, too.
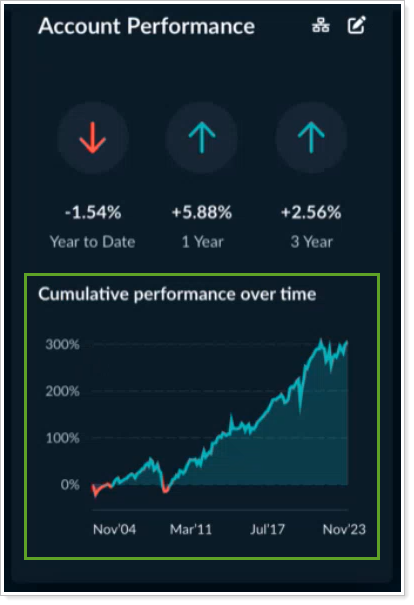
To make it easier to read long names and understand what data points are shown on a collapsed tile, the Account Performance tile now presents the account name on one line, with clearly labeled account values and performance in the remaining space.
New Mobile App Reports and Widgets: Summary, Income & Expenses, Committed Capital
The following reports now appear in the mobile app if they’re added to your Reports template:
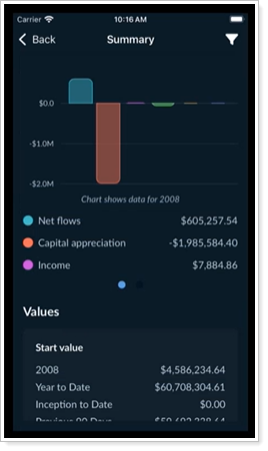
Summary report
Includes the chart, summary table, and report table, optimized for mobile.
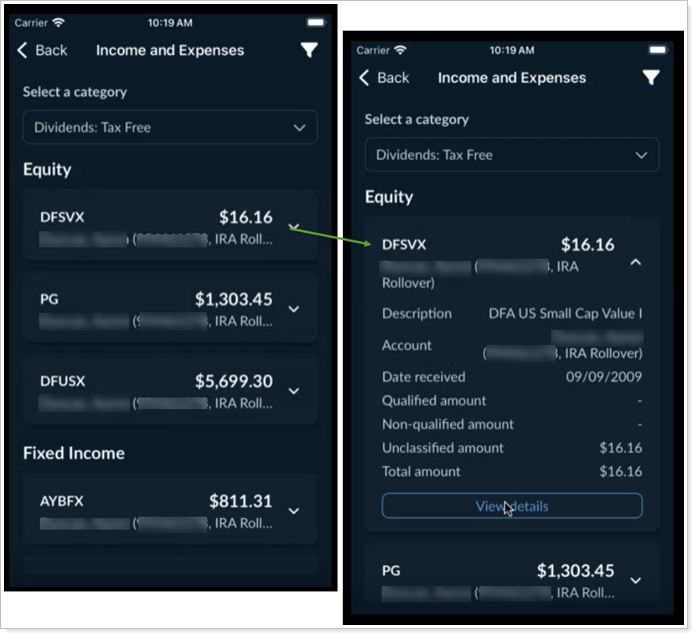
Income and Expenses Report
Shows the information from the desktop report in a reorganized, mobile-friendly format.
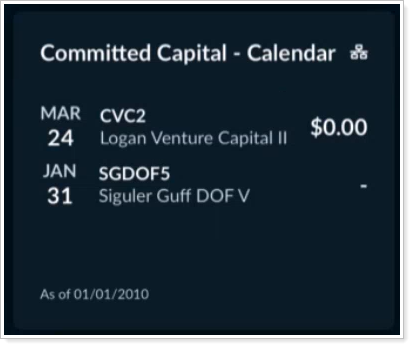
Committed Capital widgets
When you include Committed Capital widgets in the Reports template, clients will now see them in the mobile app. This includes both the calendar version of the widget and the summary version.
-
Calendar
-
Full summary
New Client Portal
Introducing the Allocation Over Time Report and Widget
We know how important the allocation over time chart is when helping clients visualize how their holdings have changed over a given date range. With this release, you can now add an all-new Allocation Over Time report and widget to the client portal Reports section and dashboard.
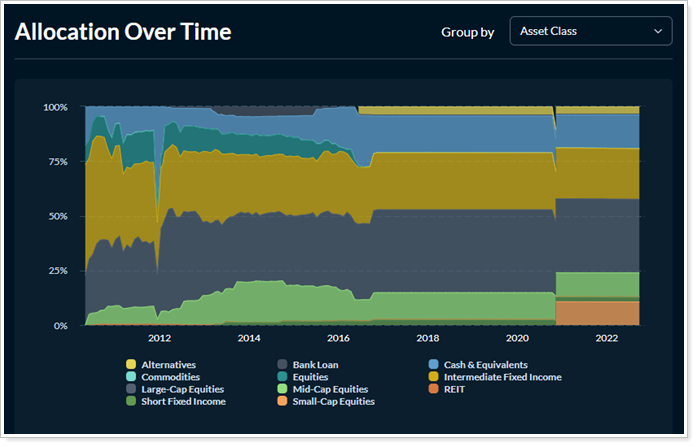
On this page, you can allow clients to choose the grouping, giving them extra flexibility to explore their data in a way that makes sense to them.
Notes
In Tamarac Reporting, you configure the Asset Allocation report to show allocation over time. In the client portal, Allocation Over Time is a stand-alone page and widget that you configure and add to a Report template separately.
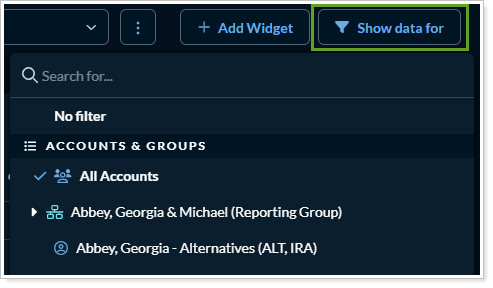
Manage the Data Source for Multiple Widgets at the Same Time
The client portal dashboard provides clients with an overview of their financial situation. But it can be confusing because, depending on their configuration, different widgets may display data from different accounts or groups. In this release, clients can efficiently set the data source for multiple widgets at the same time using the new global Show data for list.
This enhancement makes it easier to change the data source for multiple widgets at once, bringing more consistency and clarity to the dashboard. Clients will have greater confidence in their dashboard results with this enhancement.
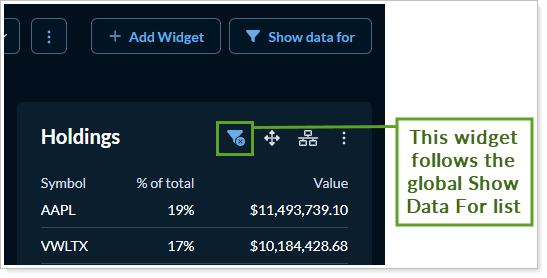
Once configured, each widget following the global setting displays a filter. This helps clients identify the data source associated with each widget.
To set the data source for widgets globally, in Show data for on the dashboard, select the desired account or group.
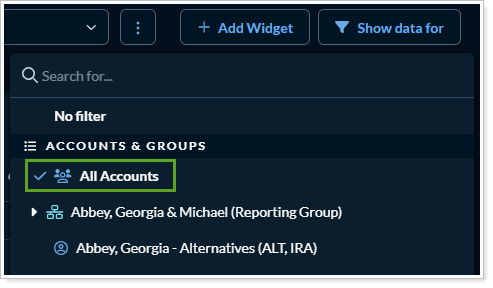
Widgets that follow the global Show data for list display the data for the selected account or group.
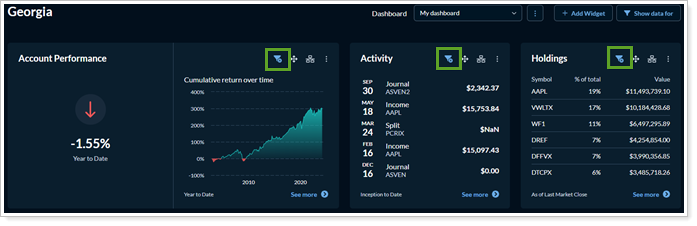
Only the following widgets follow the global Show data for list:
|
|
Depending on your firm's configuration and permissions, you may see only a subset of the widgets listed.
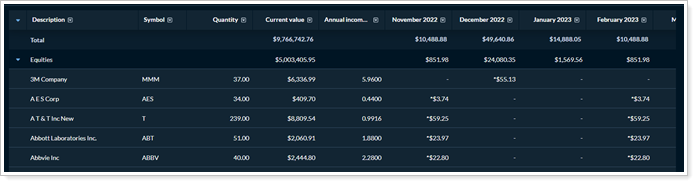
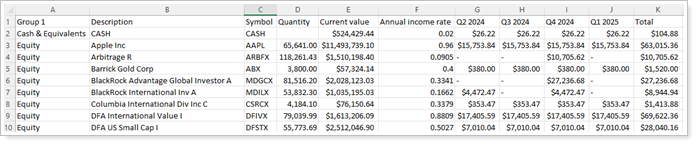
Allow Clients to Export Data Directly from Client Portal Reports
The portal offers clients unparalleled access to their financial data. Until now, they haven’t had a good way to export that data for further review or analysis. With this release, you can now allow clients to export data from report pages. This lets clients export a copy of their data for further review, analysis, or for their own recordkeeping.
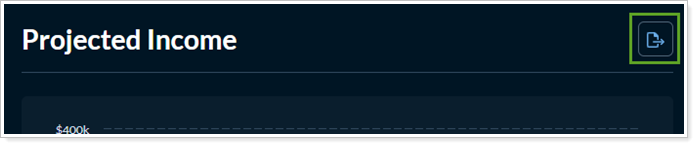
When a client selects Export, the report data is saved to the computer as a CSV file. The export includes table data and respects top-level settings: account selection, date selection, and grouping. It also includes page-specific disclosures, if included.
To allow clients to export, in the configuration tool, in the Reports template, turn on Enable CSV export for all reports.
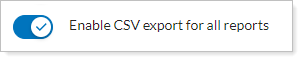
Since you control this setting at the template level, when turned on, all reports pages in the desktop client portal features an Export button.
This functionality is not available in the mobile app.
Include Multiple of the Same Type of Report in the Client Portal with Report Groups
Your clients rely on the portal to give a detailed picture of their financial situation. In the past, you could only add one of each report type to the client portal. With this release, the client portal supports as many reports of any type as you need. Now you can get the best of all possible worlds—no more having to make tough choices between report settings. Report groups support any number of reports and report types.
Want to show your clients their net and gross performance separately, but make both available on the portal? Create a report for each configuration and include both in a report group.
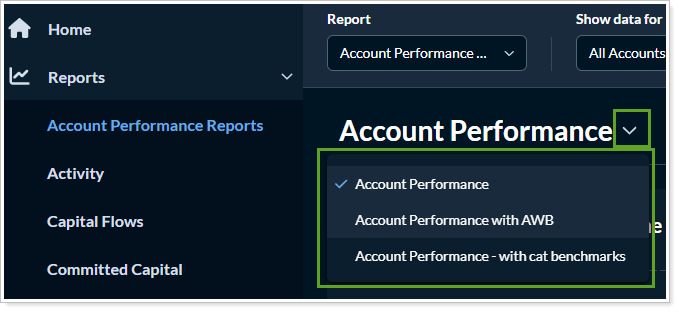
Clients will see the report group you create in the left navigation menu:
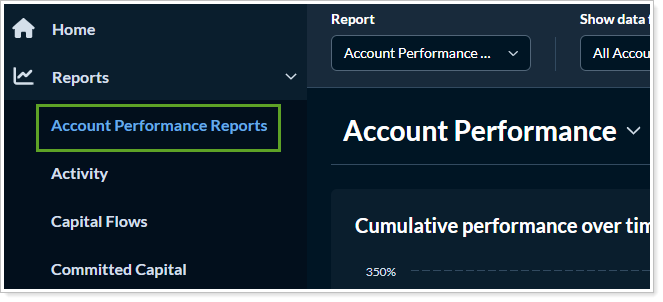
When viewing a report in the group, they can quickly switch among the other reports in the group.
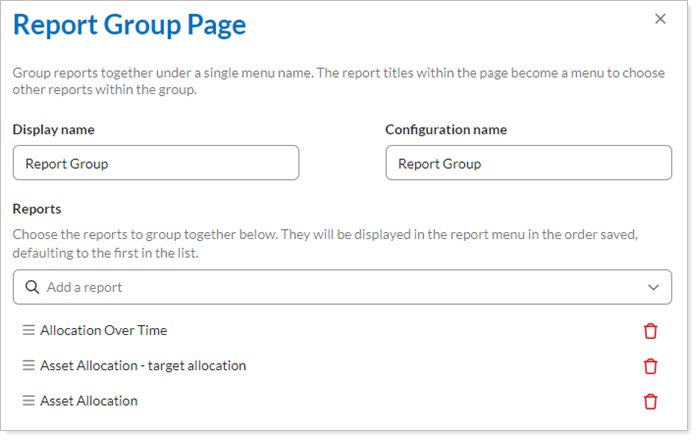
To get started, In the configuration tool, create a new report group and add it to the Reports template just like you’d add a new report.
When you create a report group, you choose what reports to include in the group.
Just like any report, you can link widgets to a report group. The link leads clients to the first report in the group.
Use Tamarac Theme Category Colors in Client Portal Reports
In Tamarac Reporting, your firm sets up themes to define category colors that show up in dynamic and PDF reports. Now, you can use these color themes in the client portal Branding template, creating a uniform experience for clients. By using consistent category colors on reports, you ensure that clients have a uniform experience between the dynamic reports you see in Tamarac, the PDF reports you generate, and the reports they see on the client portal.
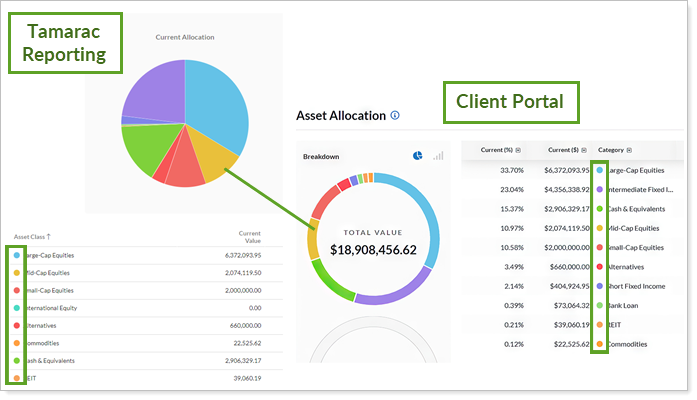
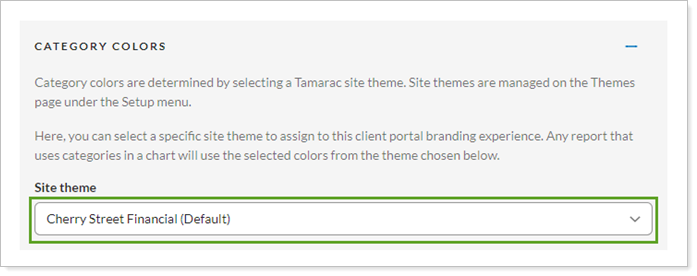
To get started, in the Configuration Tool Branding template, select the theme from the Site theme list.
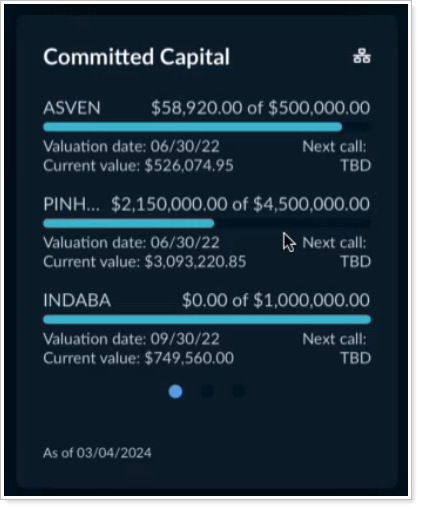
Introducing the Committed Capital Report
If you use the Committed Capital report in Tamarac Reporting, you know that it’s a valuable resource for tracking venture capital funds. Allowing clients to track their committed capital fosters transparency and keeps them informed about the status of their investments. We’re excited to introduce the Committed Capital report as a page and widget for the new client portal.
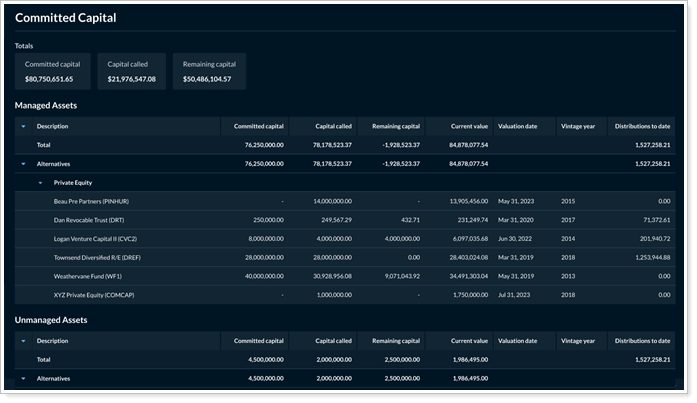
On the page, you’ll find all the familiar features you use on the Committed Capital report in Tamarac Reporting—multiple grouping options, managed and unmanaged assets, and more.
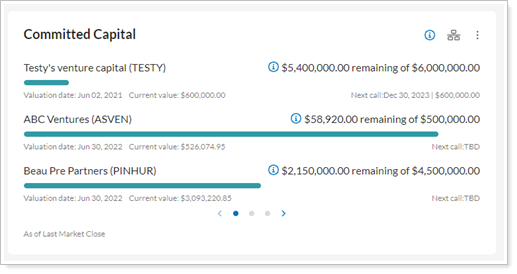
Along with the Committed Capital page, you can add a widget that provides a detailed fulfillment tracker of all the committed capital in the account or group. It shows all capital committed. Select the dots at the bottom of the widget to see additional records.
Comparative Review Includes Gains and Losses and New Columns
We've adjusted the default settings for the Comparative Review report. Now, this report defaults to the following:
-
SMA categories are turned on.
-
It includes capital gains.
-
It allows security group categories.
To let you track realized gains and losses, we've also added the following columns:
-
Long Term
-
Short Term
-
Total Gain/Loss
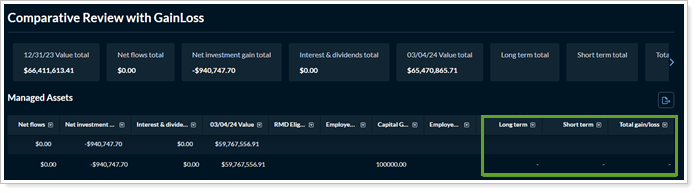
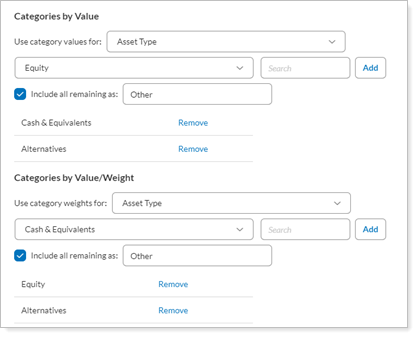
To allow you to capture more details about categories, you can also include and configure the following new columns:
When you add these columns, you select one or more categories and designate how to group everything that doesn't fall into those categories.
See More Target Allocation and Tax Status Data in Reports and Widgets
The client portal now lets you give clients more side-by-side data for analysis—of current and target allocations and of taxable and non-taxable accounts.
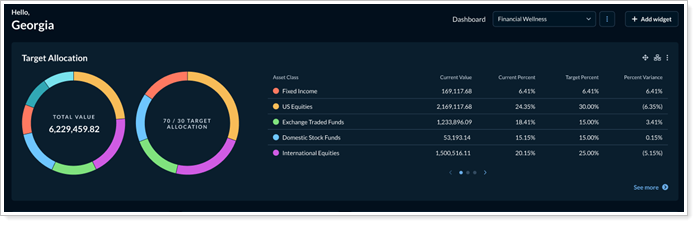
Include target allocations
On the Asset Allocation report, you can now include target allocations. Target allocations let you track and compare account holdings with account targets at the account or group level. With target allocation added, the Asset Allocation widget and page show current and target allocation charts, allocation values, and allocation percentages side by side.
Widget
Page
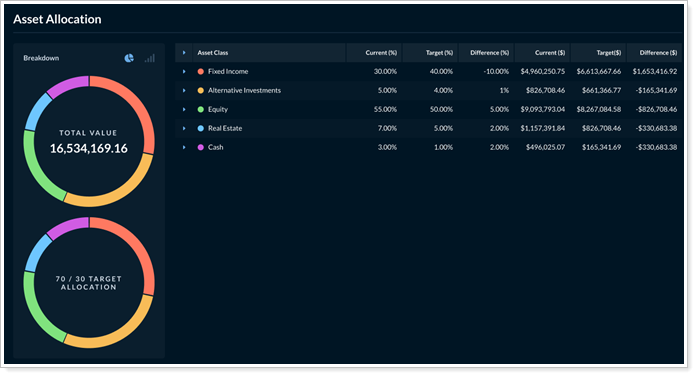
The Asset Allocation page and widget provide clients with valuable visualization of their current holdings. This side-by-side comparison of current and target allocations allows clients to make more informed decisions and builds trust as they see their portfolio aligning with the targets you set.
Include non-taxable accounts
Because it’s a tax-focused report, in the past, the Realized Gains/Losses page and widget in the new client portal only included taxable accounts. However, we know that some of you want to see a full list of all a client’s accounts on that page, regardless of tax status. With this release, you can now choose to include or exclude taxable accounts, as appropriate.
This lets you show a comprehensive report that includes all a client’s accounts, regardless of tax status, or to show a streamlined report that includes only taxable accounts. This customization allows you to create reports tailored to your clients’ needs, creating a more meaningful client portal experience.
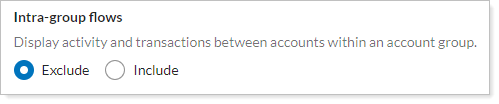
Include Intra-group Flows in Client Portal Reporting
Marking intra-group flows lets you include or exclude flows between accounts in a group from reporting metrics, as appropriate. Now, if you use intra-group flows in Tamarac Reporting, you can also control how reports in the client portal handle intra-group flows. You’ll find intra-group flow controls on the following client portal reports:
-
Activity
-
Capital Flows
-
Summary
This enhancement ensures consistent treatment of intra-group flows between Tamarac Reporting and the client portal, allowing you to confidently present values to your clients as intended.
To get started, in the client portal configuration manager, under the report, configure Intra-group flows as desired.
Expanded Holdings Report Options, Including Bond Tracking, Filtering, Grouping, and Intra-Day Pricing
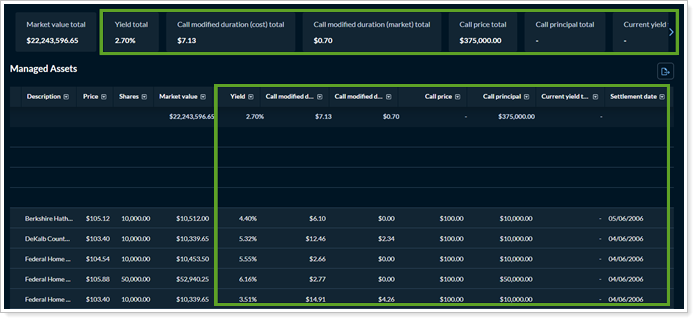
Bond Maturity Tracking
Bonds are an essential component of a balanced portfolio. With this release, if you configure it, clients can use the Holdings page to track when their bonds are maturing and the value of each as it matures.
To support this, you can add the following new columns to the Holdings page:
-
Call modified duration (cost)
-
Call modified duration (market)
-
Call price
-
Call principal
-
Principal
-
Settlement date
-
Yield to worst (cost)
-
Yield to worst (market)
These columns pull data from Tamarac Reporting and provide the same results you see on your advisor platform.
Filter to show only certain categories
With this release, you can limit the Holdings page to include or exclude only certain categories. This filtering works the same as in your advisor version of Tamarac Reporting.
The filter you set in the Configuration Tool:
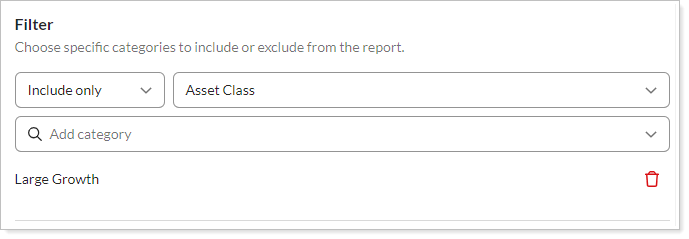
Limits what type of data clients see on the report:
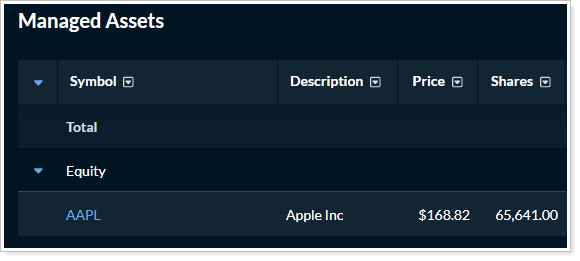
Group by category and set default grouping
To give clients more flexibility in how they see holdings organized, in the Configuration Tool you can designate a set of grouping options that the client can group by on the page. To ensure clients see what you want off the bat, you can designate the default grouping.
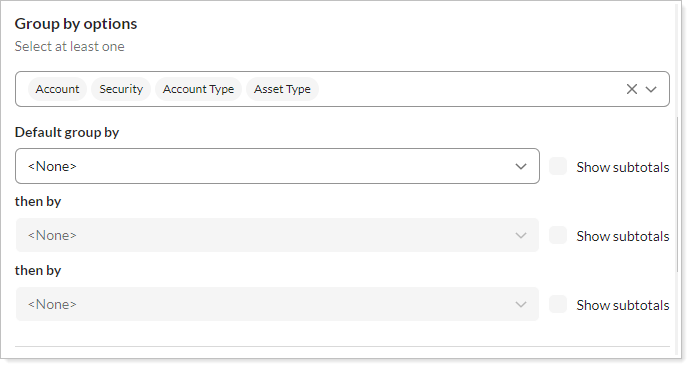
On the client portal page, in the Group by list, clients see the list of options you added. They can select up to three levels of grouping.
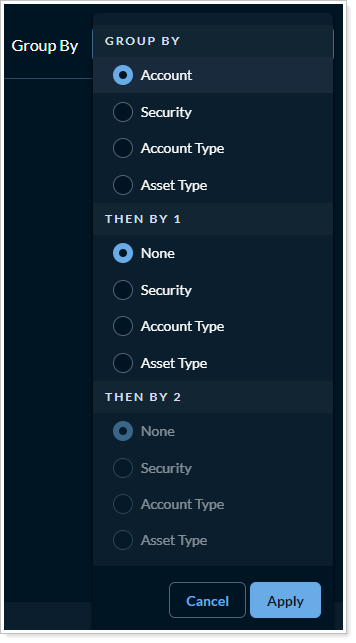
Additionally, you can now allow clients to group by redemption year.
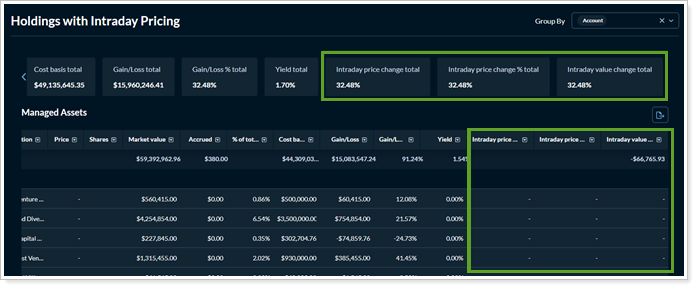
Intra-day pricing
You can now include intraday pricing data on your Holdings report when you select Allow intraday pricing. This data is continuously updated to give you a more precise view of holdings prices.
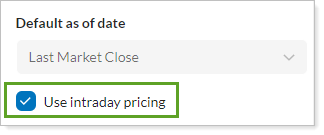
When you enable intraday pricing, you can add the following new columns to the report:
-
Intraday Price Change
-
Intraday Price Change Percent
-
Intraday Value Change
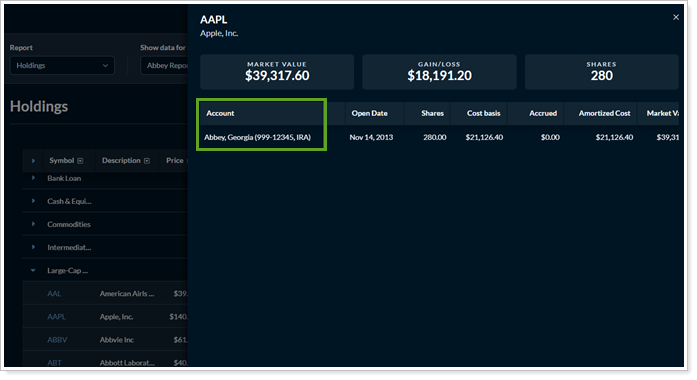
Lot-level Account Column
Additionally, we've adjusted the lot-level panel to include an Account column. This makes it easier to know which account holds each lot.
Service Team Photos Appear on the Client Portal Contact Us Page
The new client portal Contact Us page is an important directory that connects clients with their financial advisory team. With this release, the page gets a little friendlier. Now, the photo you uploaded on the My Profile page in Tamarac Reporting automatically shows up on the client portal Contact Us page.
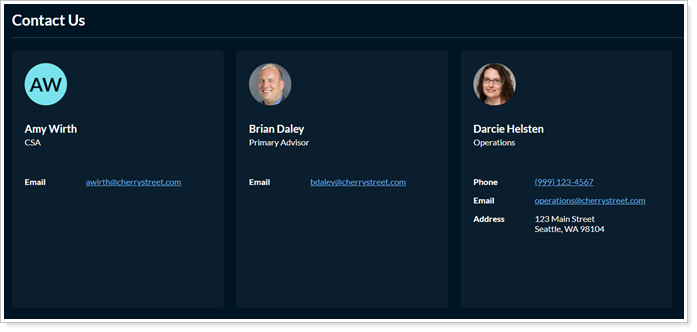
Adding a photo to your profile builds a personal connection with clients, lets them put a face to a name, and reassures them that they’re contacting the right person.
For information about adding your photo, see Add, Change, or Remove Your User Profile Photo.
Asset Allocation Uses SMA Categories
The Asset Allocation report now uses SMA categories by default. If you don't have SMA categories, the report displays your standard categories.
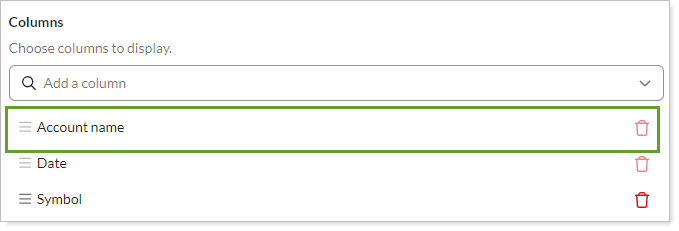
Realized Gains and Losses Requires the Account Name Column
To make the Realized Gains and Losses report easier to use and more meaningful, the Account name column is now required as the first column. You can't move or remove it in the Configuration Tool.
Projected Income Sections Expanded by Default
At your request, the Projected Income now displays all sections expanded by default. Clients can still collapse them as desired.