
Contents
Show Returns as a Percentage or Dollar Amount
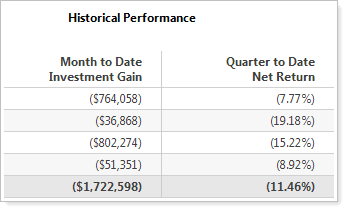
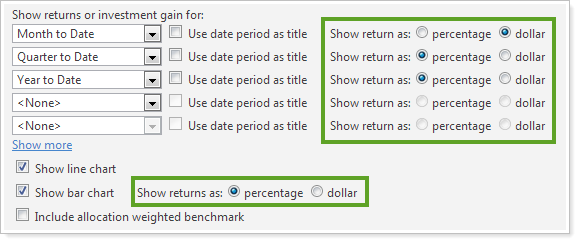
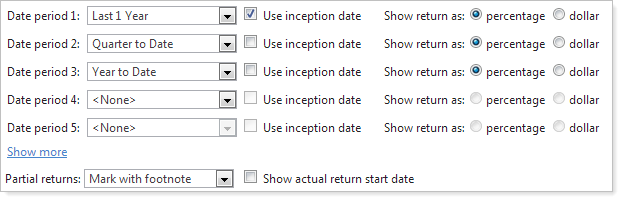
For each date period listed on a report, you can now easily show performance and investment gain in the account. If a bar chart appears on the report, you can also control the display of the return.
Investment Gain is calculated as :
Capital Appreciation + Income + Total Expenses + Change in Accrued
To check out this new feature, follow these steps:
-
Open the report settings for one of the following reports:
Account Performance PDF
Account Performance Dynamic
Account Performance PDF Dashboard
-
For each date period and chart, click Percentage to show the returns as a percentage or Dollar to show the returns as a dollar amount.
View Historical Data on the Security Cross-Reference, Holdings & Asset Allocation Reports
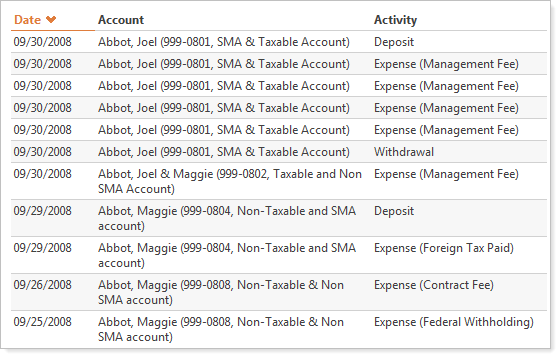
For those of you that take advantage of the Security Cross-Reference, Holdings, and Asset Allocation reports, you'll be pleased to learn that we've added an 'as-of' date to the reports, which will allow you to view historical information for any date. For example, you can run the Security Cross-Reference report to find accounts that held a specific security on a specified date.
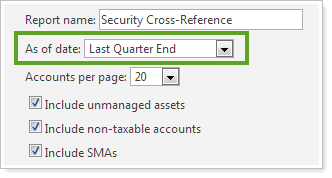
To specify an as-of date for the Security Cross-Reference, Holdings, and Asset Allocation reports, choose the applicable date in the As of date list.
Include Expenses on the Capital Flows Report
You can now include expenses on the dynamic and PDF Capital Flows report.
For example, let's say you want to calculate the contribution (withdrawal) rate of a portfolio. With this release, you can add the income tax withholding as a flow, so you can calculate the contribution rate.
Advisor View now includes any expense where you've selected the Reduce Gross or Reduce Net check box in PortfolioCenter® .
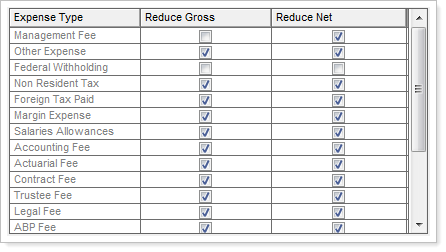
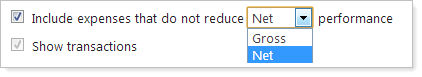
To enable this option, in the report settings for the Capital Flows report, select the Include expenses that do not reduce Gross/Net performance check box and then choose Gross or Net in the list.
More Robust PDF Dashboard
Over the years, we've heard that many of you wanted an enhanced PDF dashboard section. You told us that you wanted more available reports and formatting options. With this release of Advisor View, we're happy to give you the power to add the following reports to the PDF dashboard section:
-
Unrealized Gains/Losses
-
Projected Income
-
Realized Gains/Losses
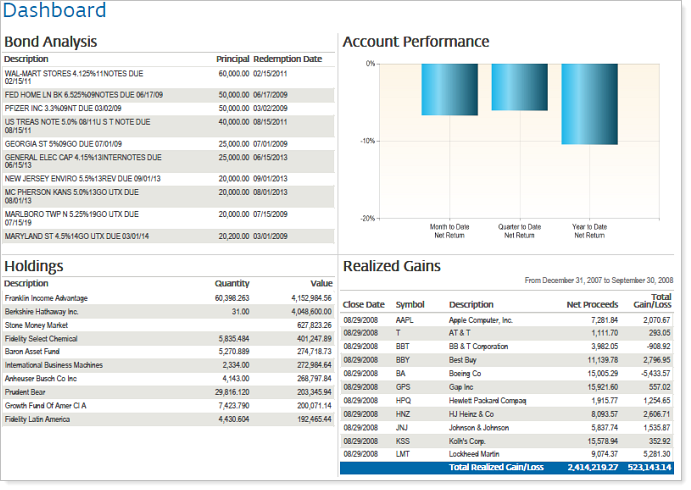
For more information about adding these new sections to a PDF template, visit PDF Dashboard Report.
Improved Display of Inception Dates
When a client has a partial period return, you have control over how the partial period return appears in your reports. For this release, we've made inception dates display more consistently in your reports.
Partial period returns are most often the cause of account or security inception dates that are after the start date of a date period used in a report. When you select the Use inception date check box on a report, the return may be included in the report.
When you do not select the Use inception date check box and the account or the security data being reported has a partial period return, the column with the partial period data does not appear on the report.
For example, below are some scenarios that may occur on the Summary report when the account inception date is 9/15/2012 with return of 5% as of 10/31/2012 and the date period is 1/1/2012 to 10/31/2012:
| Use Inception Date selected | Partial returns option | Show actual start date selected? | 1/1/2012 to 10/31/2012 return column display: |
|---|---|---|---|
| Yes | Do not mark | Yes | 5% 9/15/2012 |
| Yes | Do not mark | No | 5% |
| Yes | Mark with dashes | Yes | -- 9/15/2012 |
| Yes | Mark with dashes | No | -- |
| Yes | Mark with footnote | Yes^ | *5% |
| Yes | Mark with footnote | No^ | *5% |
| No | N/A | N/A | Column dropped |
^ New feature
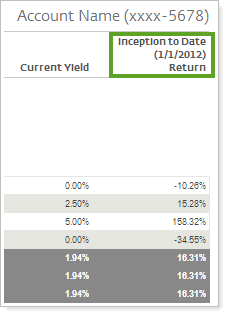
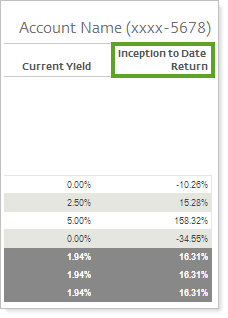
In addition, when using inception to date periods for your returns, some advisors want the flexibility to show the actual inception date on the column header. With this release, you can show the actual inception date in column headings.
| With this option enabled... | With this option disabled... |
|
|
By default, Advisor View does not show the inception date in the column heading. If you want to show the inception date, follow these steps:
-
On the PDF Templates menu, click Themes.
-
In the Select a theme list, choose the theme where you want to enable this option.
-
Click the
 next to More Options and then select the Display date in column headers for date periods of Inception to Date check box.
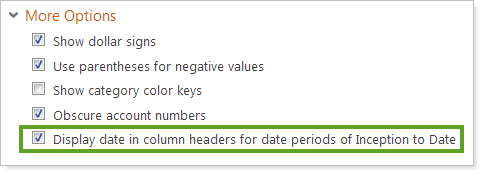
- Click Save.
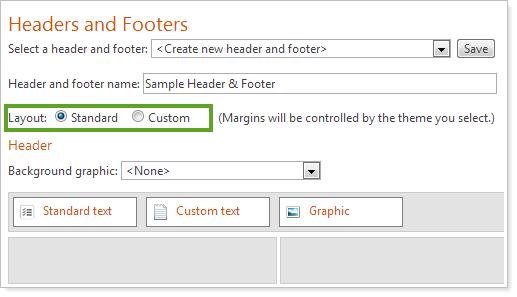
Enhanced Headers & Footers
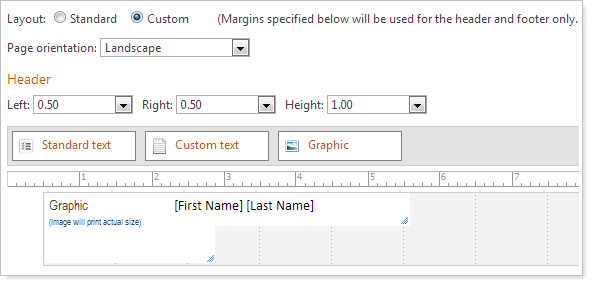
With this release, you'll likely notice that the user interface for building headers and footers has changed. These improvements are the last part of an ongoing effort to give you complete control over the appearance of headers and footers.
Highlights include:
-
Control margins. You can now control the margins of the header and footer independently of the PDF theme. For example, you can have a .5-inch margin for the headers and footers and a 1-inch margin for the display of the content. This will allow you to have a header graphic that spans the entire width of the page, while keeping your report content buffered.
-
Set the height. You can set the height of the header and footer - for example, you might want to create a 1.5-inch header.
-
Add Custom and Standard Text. Insert fields like account name, account number, full name, etc. or add freeform text.
We think you'll find the new headers and footers are easier to use and offer many new features that you'll want to take advantage of. But if you're not quite ready to make the switch, you can still create headers and footers the previous way by choosing the Standard layout.
New Global Document Access Permission
In prior releases, documents could only be edited or deleted by the advisor that uploaded the document or by the advisor that "received" the uploaded document. Some of you wanted the flexibility to define a role that could access any document - regardless of the advisor that's assigned to the account.
With this release, we're pleased to announce the 'Global Document Access' permission. Users assigned this permission can edit or delete any document.
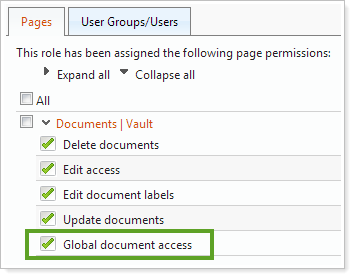
Administrators will automatically receive this permission.
For more information on user permissions and user management, visit User Management.
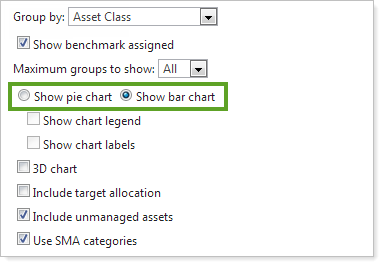
View Asset Allocation as a Bar Chart in Your PDF Reports
You now have the option to view a bar chart on the Asset Allocation PDF report. This car chart shows you the allocation of the account vs. the target allocation.
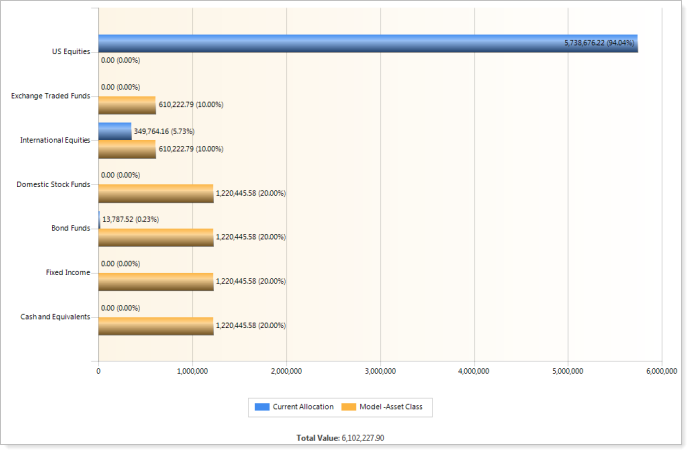
To enable this option, in the report settings, click Show Bar Chart.
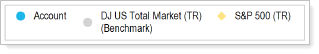
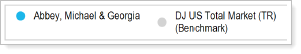
Show the Account Name Instead of "Account" on Charts & Graphs
You now have the option to include the actual account name instead of the word 'Account' on the Account Analytics scatterplot, and the bar chart, line chart, and table on the Account Performance section of the PDF Dashboard report.
| With this option enabled... | Without this option enabled... |
|
|
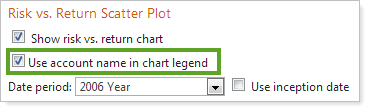
To enable this option, in the report settings of the applicable report section, select the Use account name in chart legend check box.
Usability Enhancements
We've made some additional changes to make Advisor View as easy to use as possible. While these changes aren't as powerful as most of the new features we've added, they're certainly worth mentioning.
-
We've added to the following columns to the Transactions report: Security Type, Advisor, and Entry Date.
![]()
-
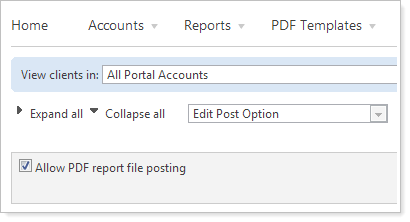
In the July release of Advisor View, we delivered the default delivery method for posting reports. Because of this change, we've removed the Allow PDF report file posting option from Advisor View. For all clients with this setting enabled, we've set the default delivery method to Download, which will prevent the reports from being posted to the client portal.
-
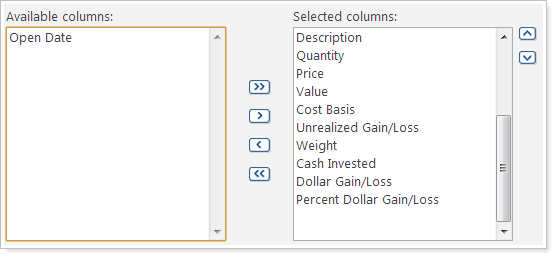
You can now add the open date to the following reports: Holdings (PDF only), Realized Gains/Losses (PDF & Dynamic), Unrealized Gains/Losses (PDF & Dynamic), and Bond Analysis (PDF & Dynamic). When not viewing lot level detail, this date will now display the first purchase date of the security - based on the oldest lot.
-
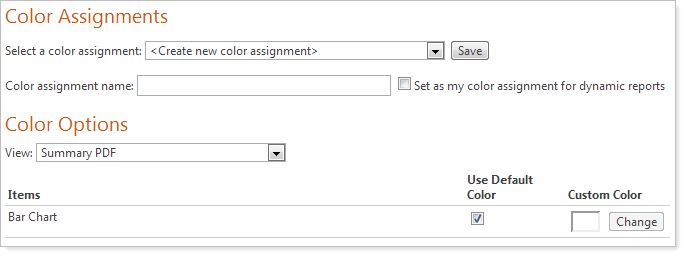
When setting up your color assignments, you now have the option to control the color of the bar chart that appears on the Summary PDF report.
-
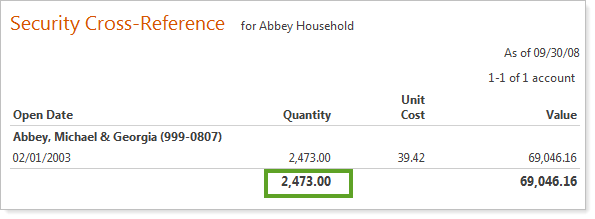
The Security Cross-Reference report now shows a total for the quantity when only one security is listed on the report.
-
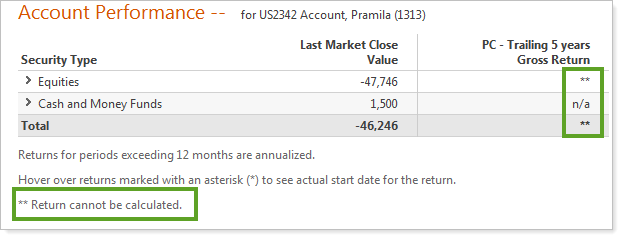
When you try to annualize returns and the losses exceed -100 percent, an error message will now display as a footnote on the report.
-
If your client has multiple accounts, Advisor View will now take the client to the last viewed account after signing into the client portal. Before this release, Advisor View would take the client to the All Accounts view.
-
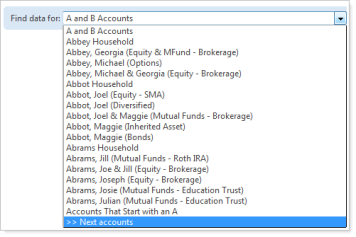
When your client views the Find data for list in their client portals, the most recently viewed accounts will now appear at the top of the list. If more than 10 accounts appear, the client can now click >> Next accounts to view the next 10 accounts.
-
We're happy to announce that Advisor View now supports average cost accounting with the following bifurcation dates as established by IRS guidelines:
Security Type Bifurcation Date Equities
January 1, 2011
Mutual Funds
January 1, 2011
All other security types
January 1, 2012