Contents
|
Easily Build Elegant Custom & Cover Sections Yield at Cost on the Holdings Report Buy Date Renamed to Open Date on the Unrealized Gains and Losses Report |
More Professional PDF Reports
From improved PDF template sections to more customization and new themes, the PDF reports in Advisor View are now cleaner and more professional.
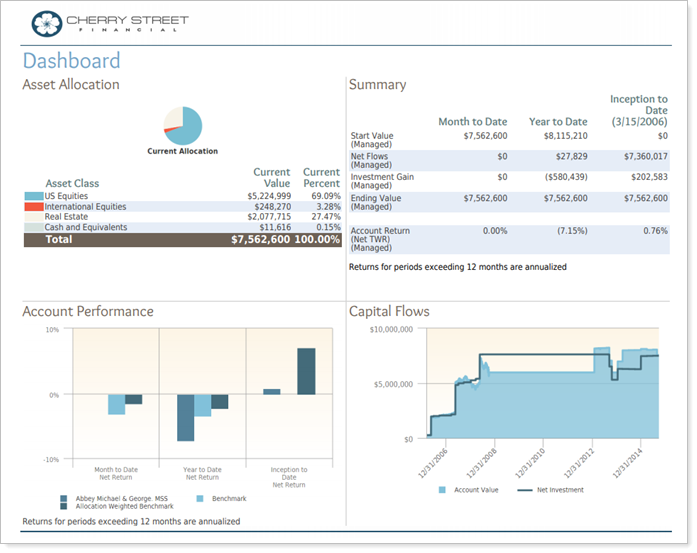
We think you'll find the new PDF reports are easier to use and offer many new features that you'll want to take advantage of. But if you're not quite ready to make the switch, you can still create PDF templates the previous way by clicking Classic Templates on the PDF Templates menu.
Themes
While Tamarac Reporting does an excellent job of helping you personalize your reports, we felt our PDF reports would benefit from a more professional look. That's why we're excited to announce that you can now apply custom themes to your Tamarac Reporting reports.
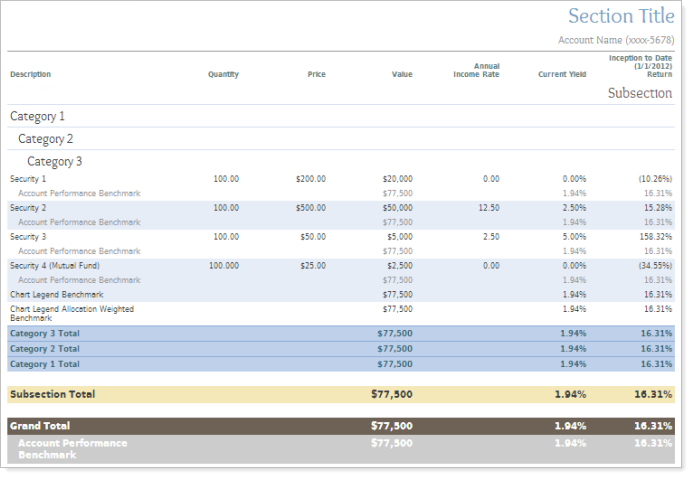
Themes give you these important features:
-
Complete control over report formatting.With report themes, you can create a consistent look for all of your reports. When setting up your report, you control the font, font color, font size, and font alignment for each report section.
-
More fonts.We added over 40 fonts to Tamarac Reporting to make it easier for you to add a little something extra to the reports you create.
-
Show or Hide Dollar Signs.Show dollar signs in front of dollar amounts or hide them on your reports - it's up to you.
-
Set the default format for negative numbers.You can choose how you want to display negative numbers on your reports. Use parentheses for negative numbers or use a dash.
-
Number precision.You have complete control over the number of decimal places to display for each field type on your reports - for example, you can specify three decimal places for mutual fund shares and two decimal places for dollar amounts.
-
Set the page orientation independently for each report section.In prior releases of Advisor View, it was easy to set the page orientation for an entire report. But some users wanted to have portrait and landscape page orientation in the same report. With themes, you can specify the page orientation independently for each report section.
For more information on creating and working with themes, visit PDF Themes.
Easily Build Elegant Custom & Cover Sections
The new custom report section builder simplifies the process of creating custom report sections. You can use the custom report builder to create professional cover pages, envelope insert pages, newsletters, personal letters, and more.
In the new version of Advisor View, you can add custom text, pictures, background pictures, data fields, and other Advisor View information directly in a custom section.
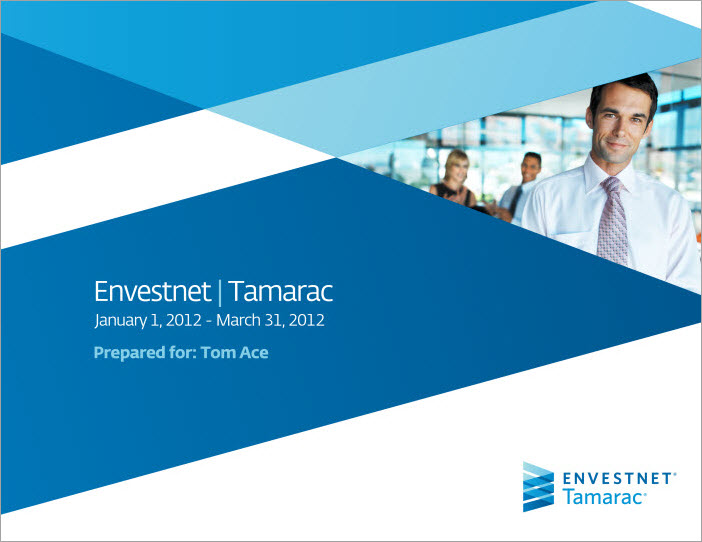
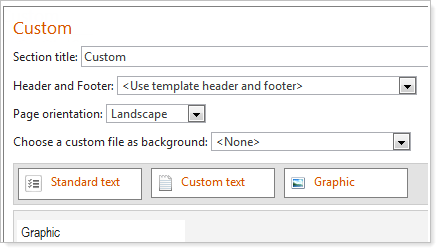
For more information on creating custom sections for your PDF reports, visit Custom PDF Section.
Improved PDF Report Builder
We've redesigned the PDF report builder for greater customization and flexibility.
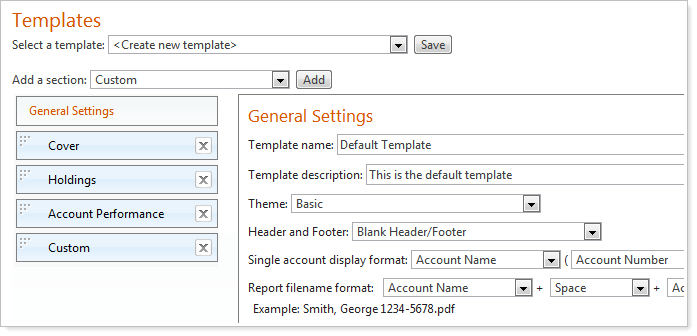
Here are a couple of the improvements:
-
Add multiple dashboard sections.There are no more limits to the number of times you can add a dashboard section. Now you can view account performance in a chart and table in the same report section.
-
Improved Design.Creating PDF templates is now easier and more intuitive.
The settings for each report section have not changed except for a few improvements detailed in these release notes, so it shouldn't take you long to get used to the new design.
For more information on creating PDF templates using the new report builder, visit Create and Edit a PDF Template.
Enhanced Headers & Footers
Many of you loved the flexibility of creating headers and footers for your reports. However, you couldn't easily reuse the same header and footer on multiple PDF templates.
With this release, we've added the additional flexibility reusing headers and footers on your PDF templates - for example, you might want all of your PDF templates to use the same header and footer.

Headers and footers can have three lines of text. For example, you can have the date on one line, account information (account name, account number, etc.) on the next line, and the page number on the last line.
The header and footer areas are also split up into three columns: left, middle, and right. The columns are distributed evenly across the page – for example, let's say your PDF template does not have any margins and is printing in landscape orientation. When you print the report, the left column will span the first 3.66 inches, the middle column will span the next 3,66 inches, and the right column will span the remaining 3.66 inches (totaling 11 inches).
Headers and footer combinations may be assigned to a PDF template or modified for each section.
For more information on Headers & Footers, visit Contents
Packaged Templates & Themes
To help you get the most out of the new report improvements, our graphic designers have created report themes and color assignments that will help you take your PDF reports to the next level.
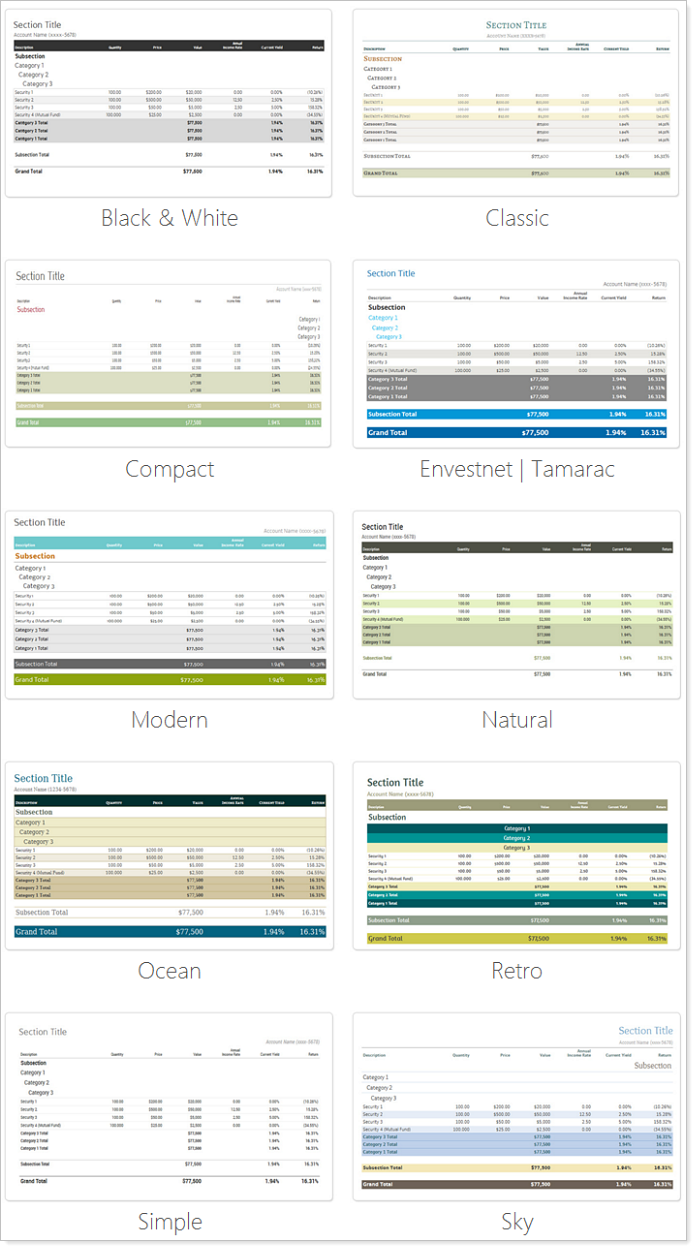
Our product experts have also configured several report templates for you to demonstrate some potential best practices in report generation.
The new report templates are:
-
Comprehensive Portfolio ReviewA detailed report template that demonstrates portfolio and holdings level information.
-
Performance ReviewIn-depth review of portfolio and holding level performance.
-
Summary ReportA brief report template that summarizes the prior period at the portfolio level.
-
Tax Planning & PreparationA focused report template for tax planning and preparation.
Billing Reconciliation
In a previous release of Advisor View, we released a billing system that delivers an array of customizable billing features, so you can bill clients based on their preferences.
In this release of Advisor View, we're pleased to introduce billing reconciliation. With billing reconciliation, you can manually and automatically reconcile payments for your services, which helps you account for every billing statement and payment in your firm. You can now mark payments as unpaid, paid, and partially paid and run reconciliation reports to track your outstanding fees.
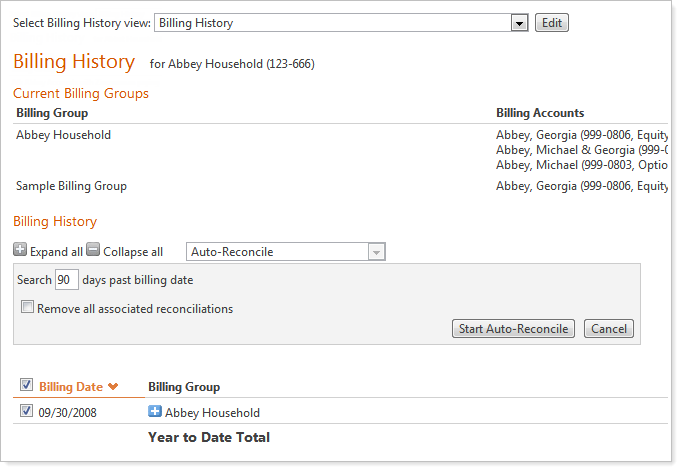
For more information on billing reconciliation, visit Billing Concepts.
Yield at Cost on the Holdings Report
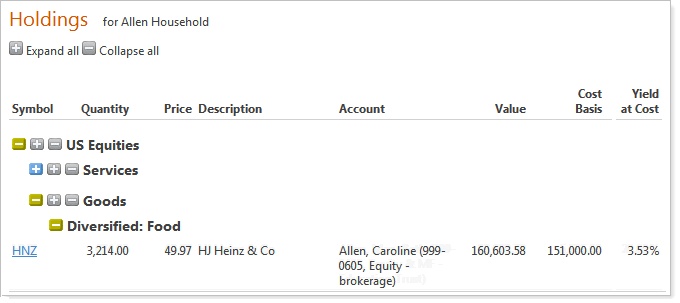
You can now add yield at cost as a column on your dynamic and PDF Holdings reports. The yield at cost is the amount of annual income divided by cost basis and multiplied by 100. When the yield at cost is 0 percent, the column will be blank.
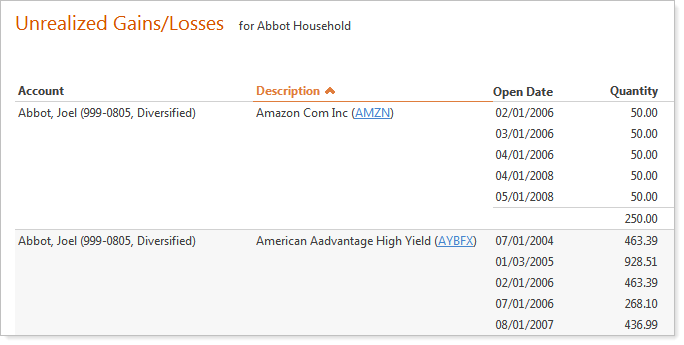
Buy Date Renamed to Open Date on the Unrealized Gains and Losses Report
To create a consistent labeling of fields across reports, we've renamed the Buy Date field on the Unrealized Gains and Losses report to Open Date.
