
Contents
Highlighted Features
Each release of Advisor View is chock-full of new features and enhancements. To emphasize some of the most important, we list them in the Highlighted Features section of the release notes.
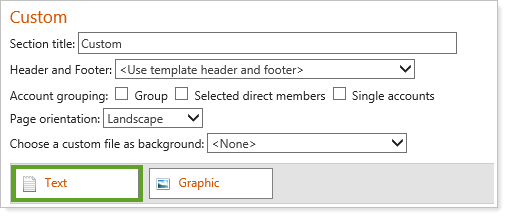
Add Merged Field Text to Custom Sections and Headers/Footers
It's now easier than ever to set up custom sections and headers/footers for your PDF reports. You can type freeform on the Edit Text screen, and can insert standard text at any point by double-clicking a merge field option, or clicking it and then clicking the  button. You can also format specific text instead of having to format the whole message. The available merge fields are customizable, and you can create your own merge fields to be used on this screen.
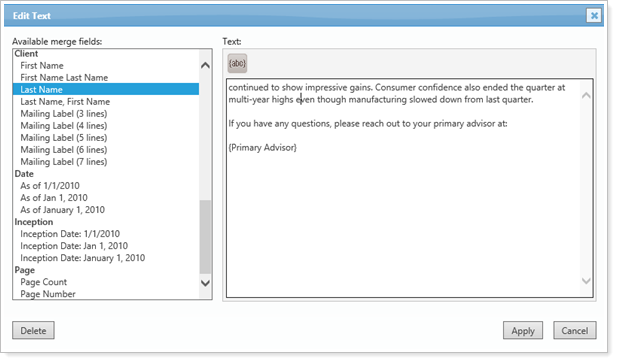
The new simplified process combines Standard Text and Custom Text so that you don't have to add them separately as before, and can instead enter and edit your text from a single text object.
IMPORTANT
As a result of this change, some users may notice font changes to existing custom pages, including spacing and font layout. After this release, please take a look through your PDF reports to ensure everything looks as expected.
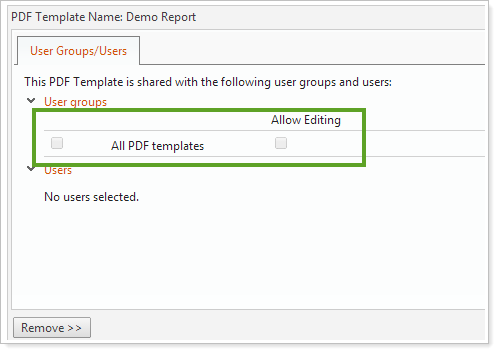
Set PDF Template Permissions to Public or Private
You can now set PDF templates as public or private, and assign permissions to protect PDF templates from being inadvertently altered or deleted. You can identify who owns PDF templates and who last modified them which provides an audit trail. You can also choose who can access a template, and whether users have read-only or edit access.
Setting user permissions helps reduce the number of unapproved or miscellaneous templates created across your firm. Users will see only the templates they have access to.
When a PDF template is created, it will only be available to the owner/author and administrators until other permissions are granted. You can assign permissions to both users and user groups—when you assign user groups, users can share a template with other users, as long as they're in the same user group.
You can set these permissions on the User Management page, when you select PDF Templates in the Manage list. The release will not restrict any existing PDF Template permissions for you, so you will still have all your current permissions until you change them.
Other permissions that you can set include who can:
-
Access all PDF templates (as administrators can)
-
Create templates
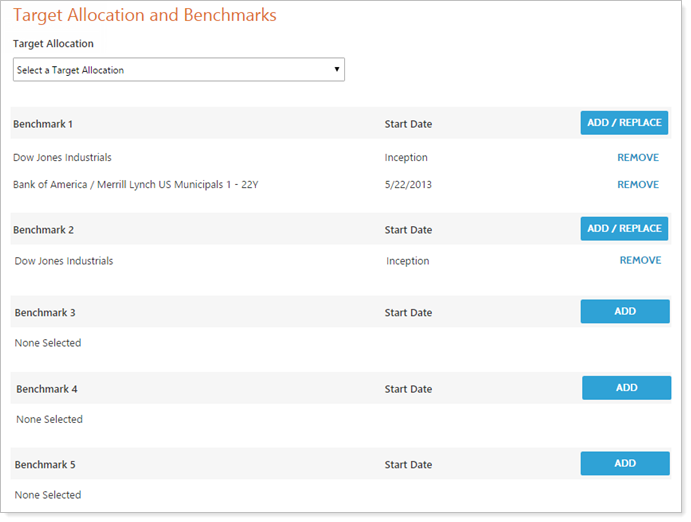
Assign Up to Ten Benchmarks to an Account
If you maintain your accounts and groups in Advisor View, we have increased the number of benchmarks you can assign to an account. You can now include up to 10 benchmarks per account/group. With more benchmarks, you can improve the evaluation of your investment performance and track progress against multiple indexes.
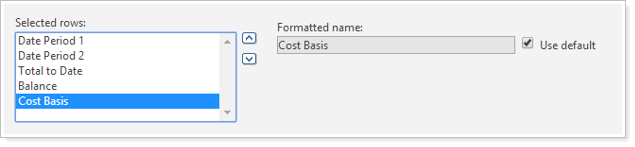
Customize Row Labels for Rows and Columns
You can now customize the row and column names for your dynamic reports, allowing you to match your client portals to your PDF reports and ensure alignment with the terminology your clients are familiar with.
For the dynamic reports, you can now single-click a selected column or row and make all your changes in the Formatted name box.
Report Updates
We're continually striving to ensure that you can add the information you want on your reports. Based on your feedback, we've made the following changes to your reports.
New Market Charts Report
We have added a new dynamic Market Charts report, which allows you to see market data and charts without leaving Advisor View. You can view 15 minute delayed prices for Dow Jones, AMEX, NYSE, NASDAQ and S&P. This report is available in the Reports menu and can be added to your Dashboard page. You can also add it to client views and set user role permissions for this report.
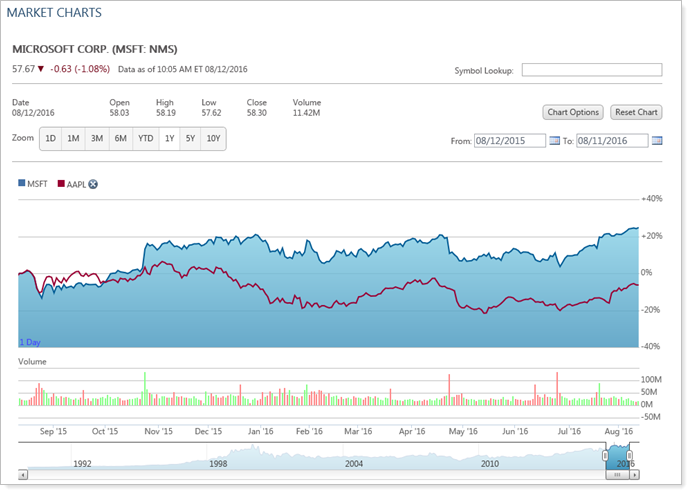
You can search for any symbol on the Dow Jones, AMEX, NYSE, NASDAQ or S&P by typing the symbol in the Symbol Lookup box. You can also add benchmarks and more by clicking the Chart Options button.
Learn More >>
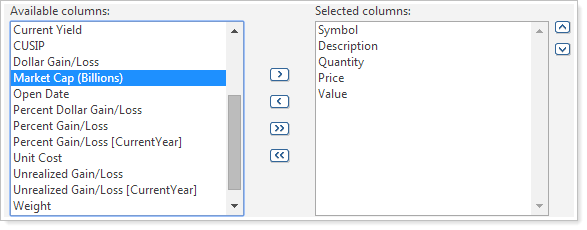
New Market Cap Field
We have added Market Cap as an available column for the Holdings report. Market Cap is available as a new security property for the Equities security type if you are maintaining securities in Advisor View. It has also been added to Upload and to the Security Information report type in Bulk Reports.
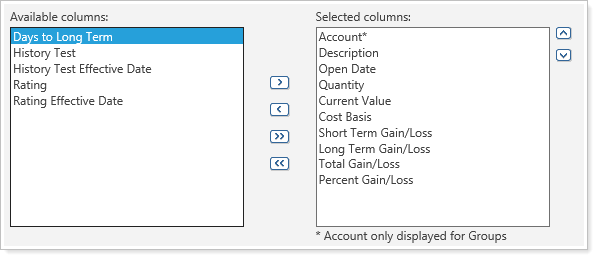
Days to Long-Term for Unrealized Gains & Losses
We added Days to Long-Term as an available column for the Unrealized Gains/Losses report. This column is only available if you select the Show lot level detail check box when you edit the Unrealized Gains/Losses report.
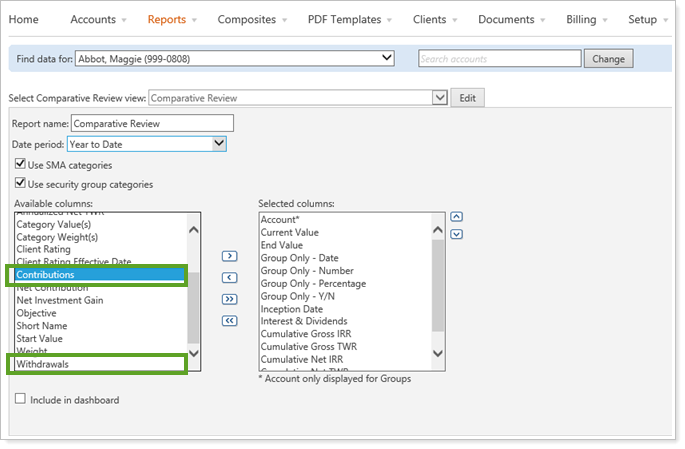
Comparative Review—Separate Columns for Contributions and Withdrawals
We've split contributions and withdrawals into separate columns on the Comparative Review report.
New Columns for the Transactions Report
We added three new columns to the Transactions report: Price, Realized Gains/Losses and Total Cost. We also added a Group by activity type check box, so you can now group by activity, with a subtotal for net amount and amount.
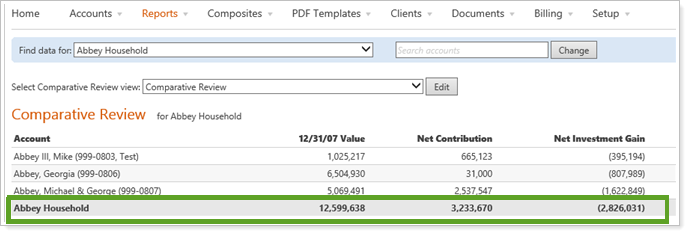
Comparative Review Total Row Updates
We updated the Comparative Review report so that column values now add up for a group "total" row.
If a group's inception is before the date period start, each account is reported as if the account existed for the entire date period, even if an account's inception is after the date period start.
If a single account's inception is after the date period start, however, and it is not reported in a group, then partial data will be reported.
Sample Annualized Deviation Calculation for Account Analytics
Currently, the Account Analytics report uses an annualized standard deviation calculation. In some cases, you may wish to use a sample annualized deviation calculation for analytics. If you prefer to use this method, please contact your Tamarac service team.
Price Columns for the Securities Page
The Securities page, accessed from the Setup menu, now has a Price column. You can edit the Securities view to choose this column. Price is a non-editable field, and also shows as an amount in parentheses next to the symbol at the top of the Edit Securities page.
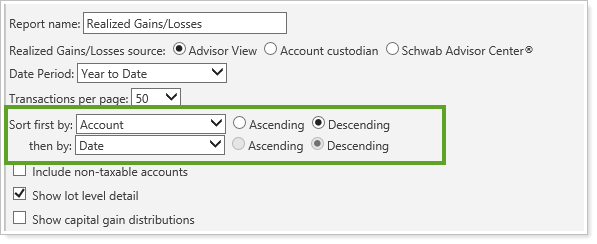
Choose the Sort Order for the Realized Gains/Losses Report
We updated the Realized Gains/Losses report so that you can choose how to sort your transactions. The report allows two sorting methods, and you can specify an ascending or descending order for each method.
Report on Historical Return Fields
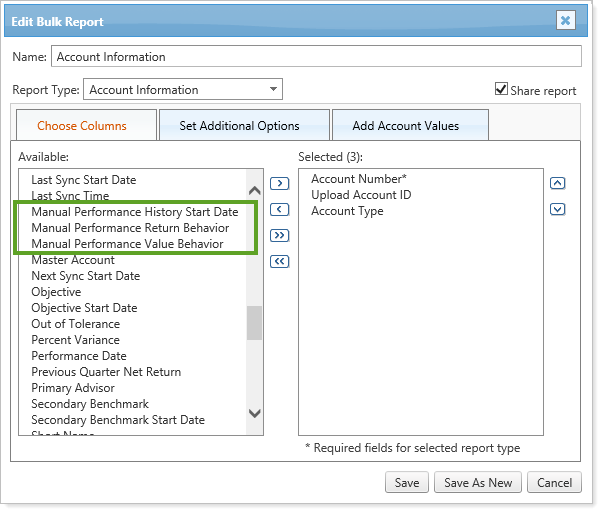
You can now run bulk reports on fields related to historical performance numbers.
All bulk reports except Security Information can also display these new fields:
-
Manual Performance History End Date
-
Can only be set if manual performance has been uploaded
-
May not be set to a date after the last date that exists for manual performance
-
-
Manual Performance Return Behavior
-
Manual Performance Value Behavior
Billing Updates
We added two new options that allow more flexibility and customization for how you view your billing statements.
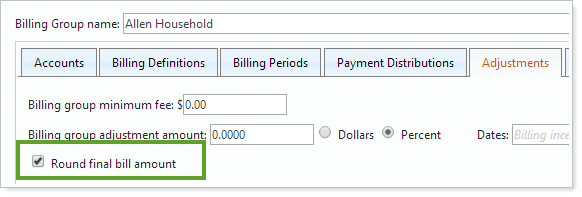
Set Billing Statements to Show Rounded Bill Amounts
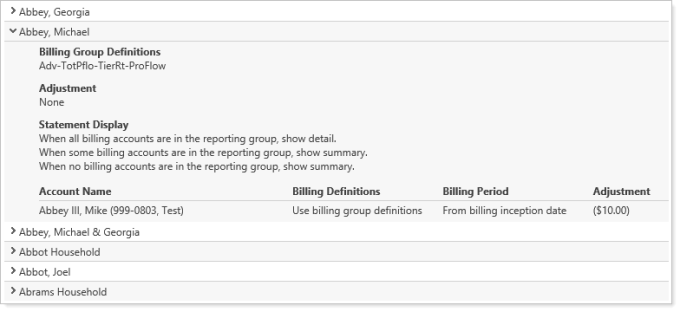
Although you've had the option to round billing amounts at the billing definition level, we have now made it possible to round your bill amounts for the billing statement at the billing group level.
Indicate Accounts with Beneficial Billing Rate Tiers on Billing Statements
You can now customize your billing statements to show which accounts have a better billing rate (for example, your ERISA accounts). The breakpoints for these accounts will be different than the breakpoints for your other accounts.
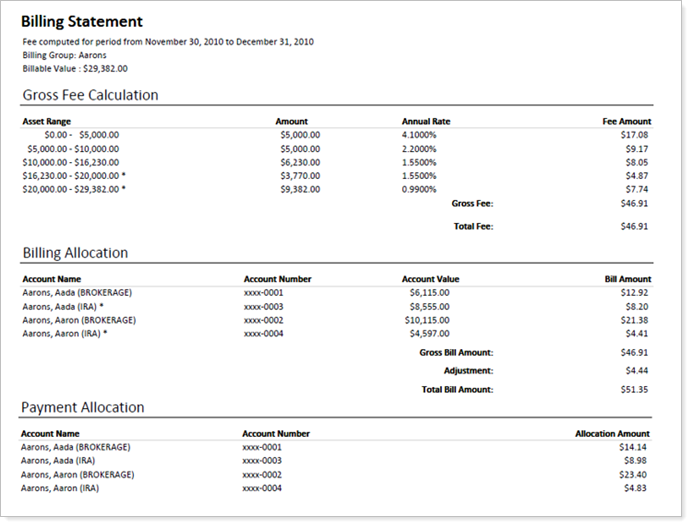
To mark the beneficial billing rate accounts with an asterisk on the billing statement, click the Beneficial billing rate tier treatment check box in the Billing section of a PDF Template.
For more information about creating a billing statement, see Billing Statements.
Search Enhancements
To help you find the information you want, we've made the following search enhancements:
-
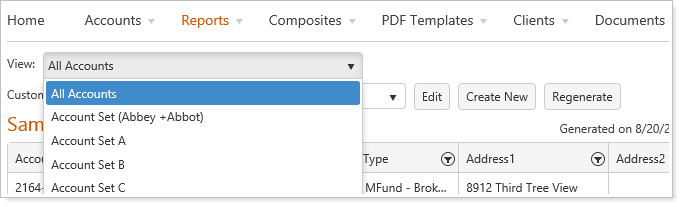
You can now search by account sets on the Custom Views page. Click Custom Views on the Reports menu to see this new search feature.
-
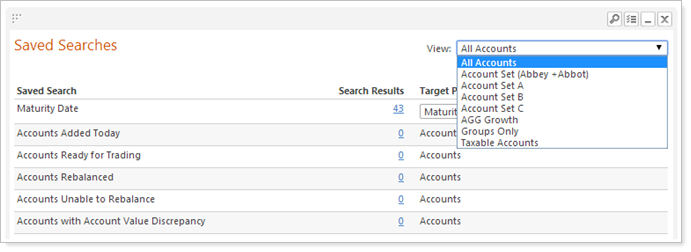
Saved Searches on the Home page can also be filtered by specific account sets. Your saved searches will update as soon as you click an account set, and when you click on search results, the filter will be automatically applied to the page that opens.
-
Searches display in real time as soon as they finish, allowing more complex searches to continue to run on their own.
-
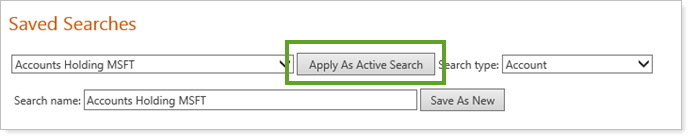
You can now create or modify a saved search without running it. When you want to run the search, you can click the Apply as Active Search button.
-
If you maintain your accounts, groups, and securities in Advisor View, we've added an Effective Date search filter for each custom field that maintains history. This change allows you to search by the date when you set a value for the field.
For example, let's say you segment your clients into service groups, such as High Opportunity, Low Opportunity, etc. With this search filter, you can create a search to identify all clients that were upgraded from Low Opportunity to High Opportunity for a date range you specify.
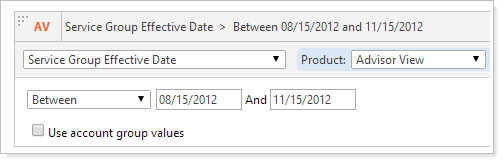
This search option has been added for account custom fields as well as security custom fields.
-
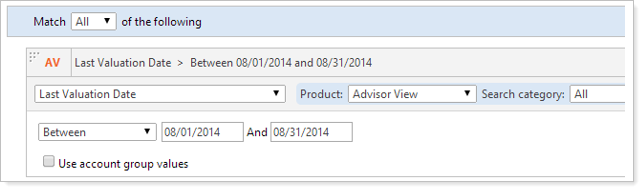
You can search all accounts for a manual security with a specific as-of date (the Last Valuation Date). You can set the new Last Valuation Date search filter on the Saved Searches page, which you can access from the Accounts menu.
Corrected Issues
We've corrected the following issues in this release:
-
Closed positions with transactions on the as of date no longer display on the Account Performance report. Previously they showed as N/A for all return periods and showed zero value.
-
You no longer have to worry about duplicating field names when you create custom fields. If anyone enters a name that already exists for a dynamic or bulk report column, Advisor View will refuse it. Advisor View also checks new fields two weeks before each release, and firms will be notified of any duplicates so that they can rename them. If any duplicates remain when the release occurs, the names will be appended with “(c)”.
-
If you enter a “<” or “>” character in a field and attempt to save, you will receive an error message. The field won't just save as a blank field any more. Date period names and date names cannot contain the “<” or “>” characters. Custom fields can't contain those characters either, and also can't contain square brackets. These characters are reserved for coding purposes.
Usability Enhancements
We've made the following changes to make Advisor View even easier to use:
-
For those of you using the Schwab Intelligent Integration with Advisor View, you may be asked to accept the terms of the Schwab license agreement. We've updated Advisor View to check for updates to the license agreement and present the new terms to you when you access any of the Schwab Intelligent Integration functionality.
-
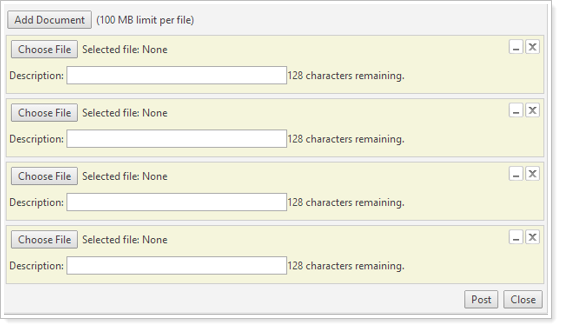
No more uploading documents one by one for your clients—with this release, it is now possible for your clients to upload multiple documents at once on the client portal.
-
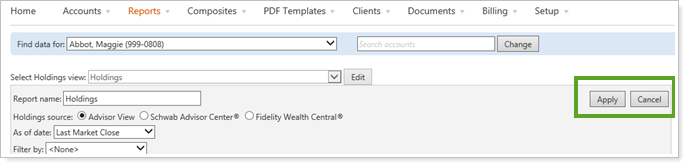
When you edit a report, you will see new Apply and Cancel buttons at the top of the page.
-
We've added an AccountType field to the Account Information dataset that's exported to Advisor Rebalancing.
-
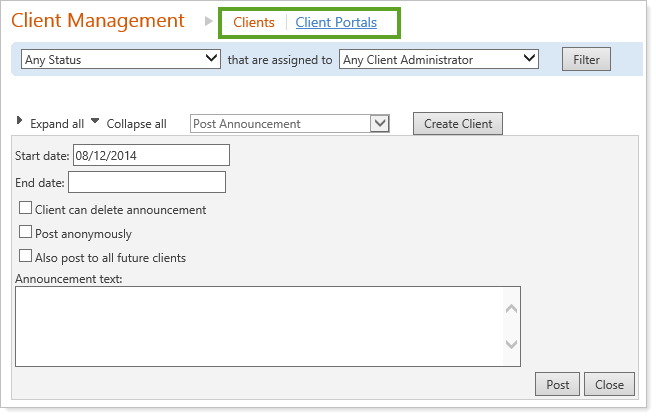
We simplified the Client Management page by turning the View list option (Client or Client Portal) into links.
-
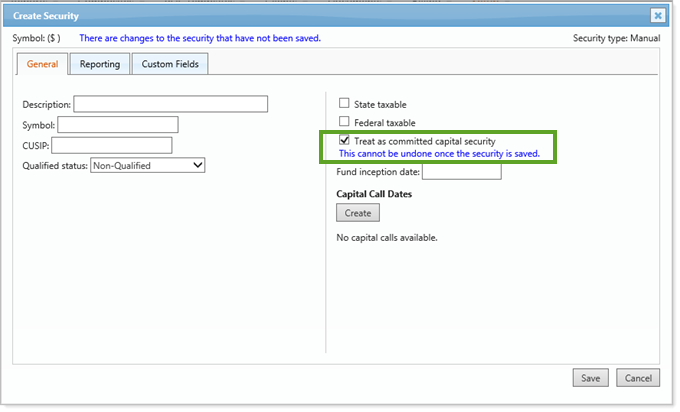
The Treat as committed capital security check box is now irreversible. Once you select the check box and click Save on the Create Security page, the check box will be grayed out. A warning displays when you select the check box, so that you will be aware that the action is irreversible.
-
For tables that have alternate row shading, Advisor View now displays expanded rows with shading that matches the parent row.
-
We've upgraded the software we use to create your PDF reports. While you won't directly see the benefits of this change right now, it does provide the framework for some exciting features in the future.
-
The Custom Web Page module now has an indicator to let you know when the web content is loading.
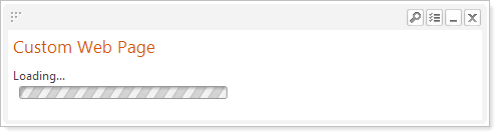
You can also choose whether the web page shows within a normal dashboard widget – with gray borders and icons for changing settings, minimizing, and removing the widget. This option is set with the Show border check box when you add the Custom Web Page module to your Home page.
-
You can now enter account types of up to 64 characters and are no longer limited to 32 characters.
-
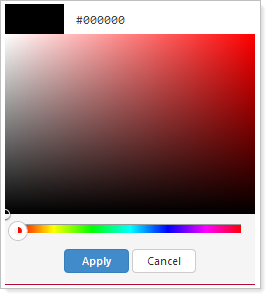
We've added an enhanced color picker to the following pages: Report Themes, Themes, and Headers and Footers. The new color picker allows for better control when you manually select the color you want. As always, you can instead type a hexadecimal code in the box at the top of the window.
-
The transaction entry date for the account security snapshot generated transactions is now set as the snapshot creation date. Previously, the entry date was continually updated to today's date instead of reflecting the actual entry date.
-
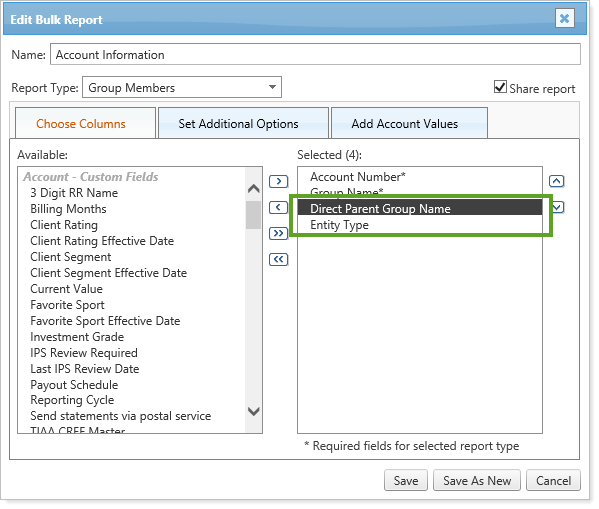
We added a Direct Parent Group Name column to the Group Members bulk report. This column displays the direct parent of the single account in the group. We also renamed the Member Type column (which uses the value “Account”) to Entity Type (which uses the value “Single Account”).
-
Benchmarks on the Summary report will now display as Benchmark instead of Portfolio Benchmark, so that it's consistent with all other reports in Advisor View.
-
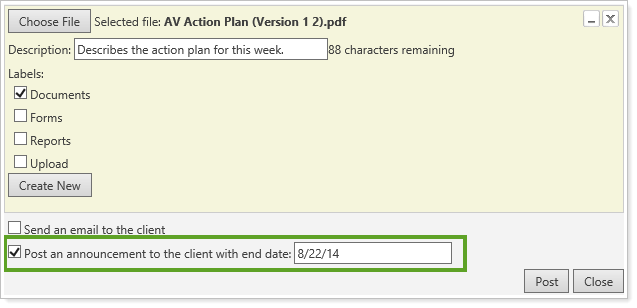
When you generate a PDF report and post it to a client portal, you can now add an end date for the announcement. The announcement is then automatically removed on that date, and you don't have to remember to go back and manually delete it.
-
If you have symbols longer than nine characters on PDF reports, they will now automatically be split onto a second line near the ninth character, allowing you to include more columns on your PDF reports and reducing rendering errors. If there are spaces in your symbol, the line will usually be split at the space instead.
For example, let's say you have a custom symbol of CUSTOMTICKER. Before this release, the entire symbol displayed on one line, creating a wide column. With this release, the symbol will be split onto a second line near the ninth character:
CUSTOMTIC
KER
If you have a space in the symbol, such as CUSTOM TICKER, then the symbol will usually split at the space:
CUSTOM
TICKER
You can take advantage of this new feature on the following PDF reports: Amortization and Accretion, Bond Analysis, Capital Flows, Holdings, Income and Expenses, Position Performance, Realized Gains/Losses, Recent Trades, and Unrealized Gains/Losses.