
Contents
|
Resizable Modules in Section Layout New Pivot Table data type in Report Studio Module settings |
Report Studio
Resizable Modules in Section Layout
What's changing
Report Builder now gives you more control over section layouts. In earlier versions, you could add only a limited number of modules to a section. This release removes that limit and introduces a more flexible layout system.
Now, you can place multiple modules side by side and resize them to create dashboard-style sections. This update mirrors the capabilities of existing PDF dashboard templates and helps you organize data more effectively while displaying more information on a single page.
Use these controls to arrange data exactly where you want it or to fit more information into each section. Resizing modules gives you greater flexibility to design reports that meet your clients’ needs.
This enhancement includes:
-
Resizable modules. Adjust the width and height of individual table and chart modules to fit your specific design requirements.
-
Flexible module placement. Move modules freely within a section to create custom layouts, such as placing two tables side by side.
-
Enhanced section spacing. Use new settings for module spacing and borders to create clearer visual boundaries between data components.
-
Dashboard-style layouts. Build sections that look and feel like legacy PDF dashboard templates for a more condensed and informative presentation.
-
Consistent PDF formatting. Ensure that your custom layouts translate cleanly to PDF output while maintaining consistent formatting across all rows and columns.
Why you'd use it
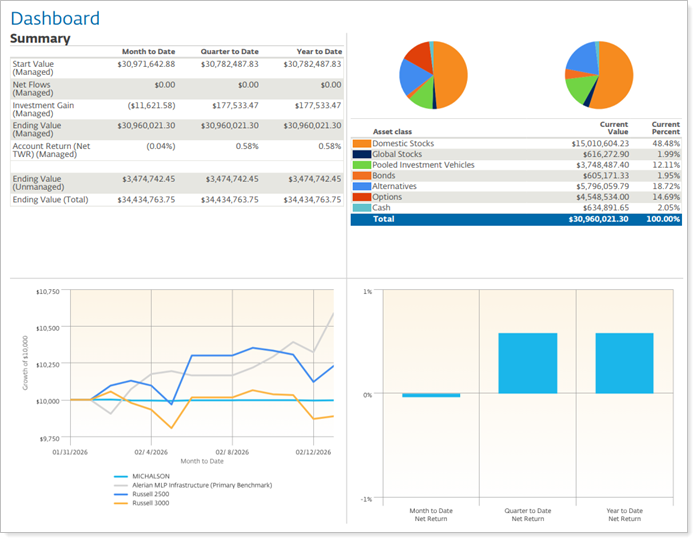
Use this feature to build dashboard-style sections that provide a high-level view of client portfolios on a single page. For example, position a performance chart next to a summary table, so clients can view trends and underlying data at the same time.
You can also create sections such as a Market Overview that include multiple tables for different asset classes, all arranged in a clean, easy-to-read grid. Resize modules to emphasize key information and keep supporting data in smaller adjacent views, giving you more control over how you organize and present insights to your clients.
How to get started
To start customizing your layouts, open Report Builder and select a report section. Drag and drop modules from the library into the section, then use the resize handles on the module borders to adjust their dimensions.
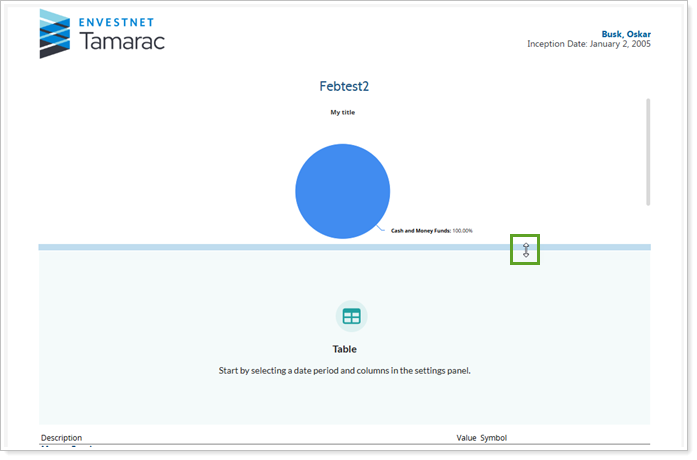
You can also use the Layout tab in the Module Settings to fine-tune padding, alignment, and border options.
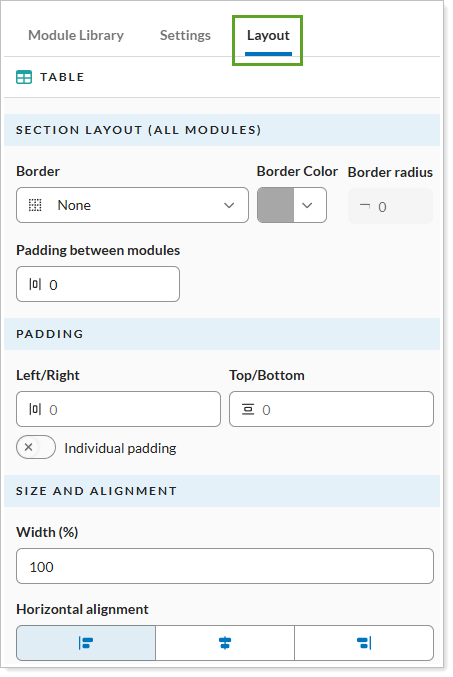
Once your arrangement is complete, use the Preview toggle to verify the layout before saving your report template.
Additional information
For more information, see:
New Pivot Table data type in Report Studio Module settings
What's changing
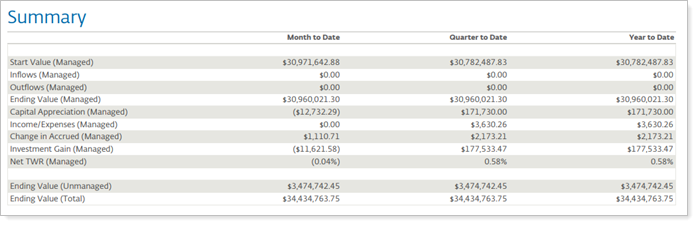
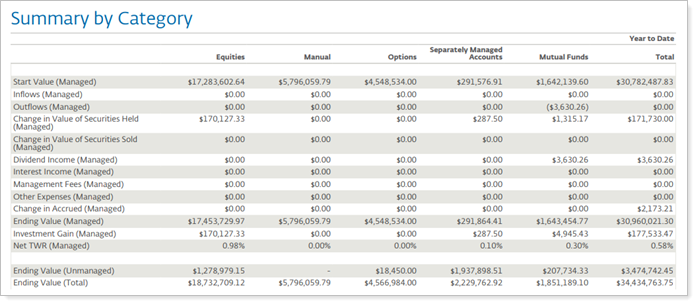
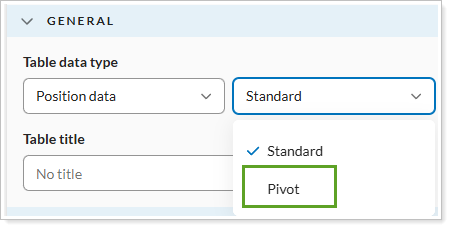
Previously, summary-style layouts required separate reports or offered limited formatting options. With this release, we’re introducing a new Pivot table data type in the Report Studio Table module, giving you more flexibility when designing reports. It lets you create summary-style layouts that mirror Summary and Summary by Category reports and compare the same data across multiple periods.
With the Pivot table data type, you can display multi-period columns, control data selection at the datapoint level, and group data by category to highlight key insights. You can also add blank rows and dividers to improve readability, maintain consistent formatting, and control how managed and unmanaged assets are included for more precise reporting.
Summary
Summary by Category
Summary table on dashboard
This release includes:
-
Totals aggregation options: Choose Managed, Unmanaged, or Combined totals for asset data aggregation.
-
Blank row support: Insert blank rows for better formatting.
-
Category-based grouping: Group data by category.
-
Multiple date ranges: Display data across several date periods in pivot columns.
Why you'd use it
Use this feature to create customized summary reports that show client portfolio data across multiple time periods. It helps you present complex information in a clear, simplified format, such as a Summary by Category report, so clients can quickly understand asset allocation and performance. With the Pivot table type, you can combine high-level totals with detailed data to support more focused and flexible portfolio reviews during client meetings.
How to get started
To begin using this feature, open Report Studio and create or edit a report. Add a new table module and select Pivot from the Table Type dropdown menu.
Use Module Settings to configure your datapoints, add blank rows, or enable category-based grouping. Once your layout is complete, select Save to apply the changes to your report template.
Additional information
For more information see:
New Transactions Data Type in the Table module
What's changing
Previously, you couldn’t include transaction-level details directly in the Table module. Now, you can use the Transactions data type to add detailed transaction activity, such as trades and income, to custom reports. You can also group and filter transaction data to match your clients’ needs and present a clearer view of account activity for a selected period.
![]()
The Transactions table data type includes the following capabilities:
-
Group transactions.Organize data by activity, money security, account attributes, categories, or dates to give reports a clear structure.
-
Control the level of detail. Use Show position/transaction detail and Show lot detail to switch between summary views and detailed lot-level rows.
-
Filter transaction activity. Filter transaction lists by specific activity types, including expenses, income types, and journals.
-
View clearer activity names. Manual security snapshot transactions now display descriptive names, such as Journal (Total Market Value) and Withdrawal (Distributions), instead of generic labels.
-
Include custodian-provided realized gains and losses. Add custodian-sourced realized gains and losses to reports and use the new setting to help prevent duplicate records when multiple data sources are included.
Why you'd use it
Use this data type to create transaction reports tailored to your clients’ needs. It combines detailed transaction data with the flexibility of Report Studio, so you can provide clearer and more useful insights.
For example, use Show lot detail to explain sell or transfer transactions that involve multiple tax lots. Use Only include realized gain/loss transactions to improve accuracy for mixed account groups and help prevent duplicate records.
How to get started
To get started, open Report Studio and create a new table or edit an existing one. In General settings, set the Table data type to Transactions.
![]()
Then choose your date range, grouping options, and filters in Module settings. When you've finished, save the table to add it to your report template or module library.
Additional information
For more information, see:
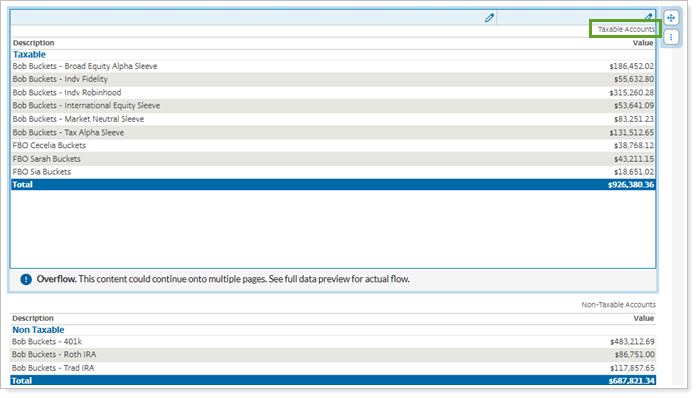
Filter by Account and Security Saved Searches
What's changing
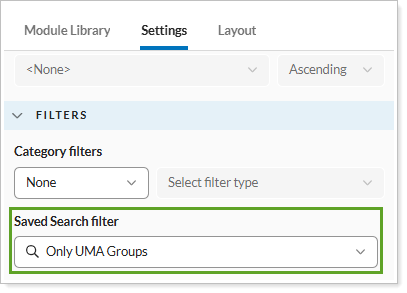
We understand how important filtering is for you in Report Studio. With this release, Report Studio now supports Account Saved Searches and Security Saved Searches in module filters. Select a saved search from your firm’s library to include or exclude specific groups of accounts or securities directly in module settings.
This feature lets you reuse saved search criteria you already defined in Tamarac Reporting, so you can control which data appears in each module. You can use it to build more targeted reports for complex client portfolios.
Only UMA Groups
Only taxable acconts/groups
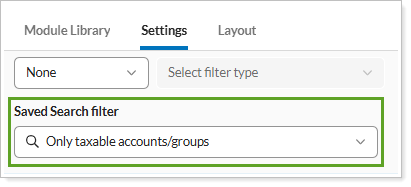
This enhancement allows you to:
-
Control filters at the module level. Apply different filters to different modules in the same report instead of relying only on global report filters.
-
Keep results up to date. When saved searches change in Report Studio, modules that use them reflect the latest data the next time you generate the report.
-
Find saved searches faster. Use a structured menu with a text filter and search categories to quickly locate the saved search you need.
-
Use clearer category names. Updated naming for existing category filters improves clarity and consistency across the interface.
-
Show temporary text only when needed. Updated logic displays temporary text areas only when they are relevant to your current configuration.
Why you'd use it
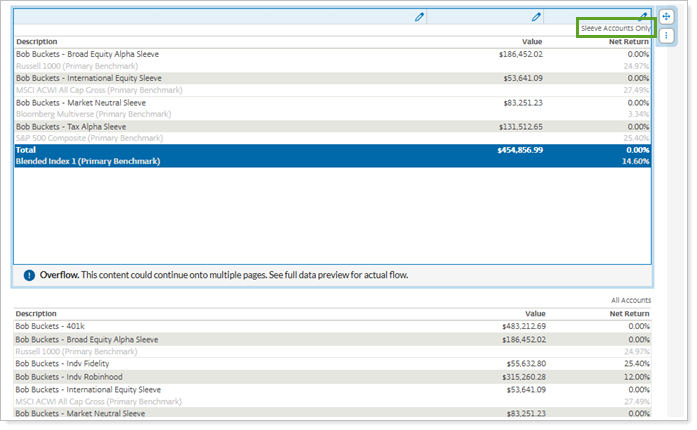
Use this feature to create report sections that focus on specific parts of a client portfolio. For example, if you manage Unified Managed Accounts (UMAs), you can filter a module to show only sleeve accounts in a sleeve performance section. You can also apply a saved search to show only taxable members in a large household group, so tax-sensitive data appears in the appropriate context.
How to get started
To start using these filters in Report Studio, open the module you want to edit. On the Filters tab, select an account or security saved search from the new saved search menu. Then save the module to apply the selected filtering criteria to your report template.
Additional information
For more information, see: