
Contents
Usability
Updated PDF Template Page Look and Feel
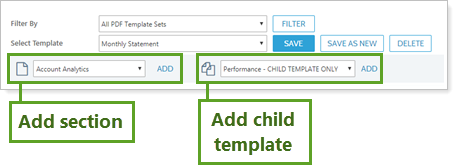
Tamarac's powerful PDF reporting templates offer unparalleled customization—which can also make it challenging to find the exact setting you want. With this release, you'll find a host of updates that make creating PDF reports more straightforward than ever.
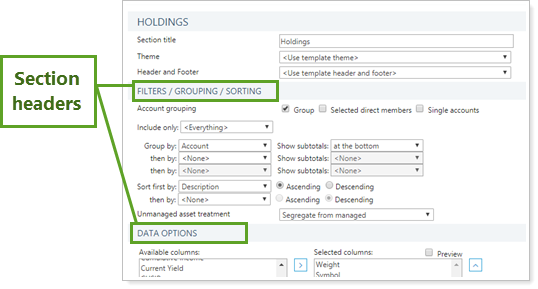
When you open the PDF Templates page, you'll notice the following improvements:
-
The updated PDF Templates page is cleaner and easier to use, while still incorporating all the PDF building features you're accustomed to. Plus, you'll find more intuitive drop-down lists for adding report sections and child templates.
-
Cleanly organized settings on each PDF report section allow you to quickly find the settings you want to customize.
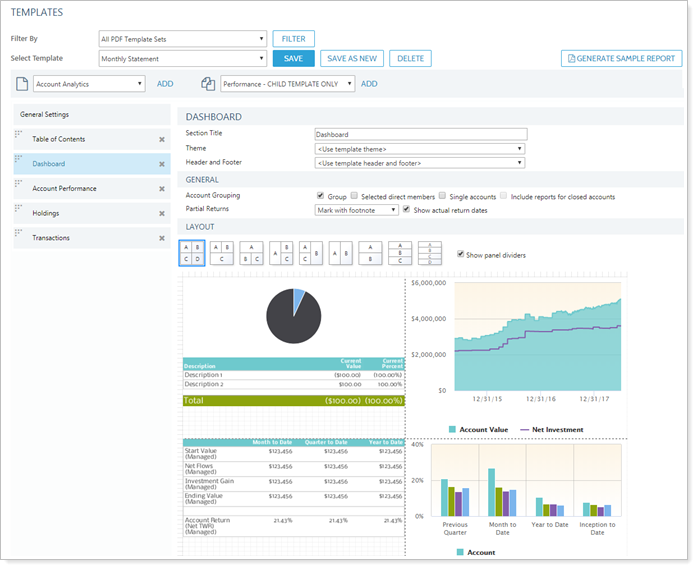
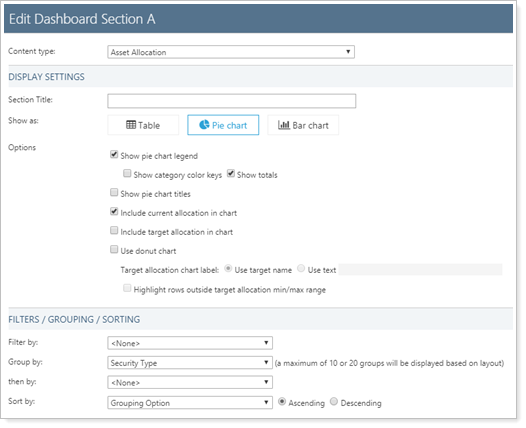
Intuitive Visual PDF Dashboard Builder
Dashboards help break down what can be an overwhelming amount of information. This holds true for PDF reports, where dashboard sections allow you to highlight important metrics for clients. The new PDF dashboard builder, which you'll see when you add a Dashboard section to a PDF template, offers more features than ever for building engaging and beautiful PDF reports.
With this release, you'll notice the following changes to how you build PDF dashboards:
>> Visual Layout
Build a dashboard in the new visual editor and see changes as you make them.
>> Drag-and-Drop Panel Resizing
After picking a basic layout, drag and drop panel borders to customize panel sizes. Charts resize automatically to fit the panel.
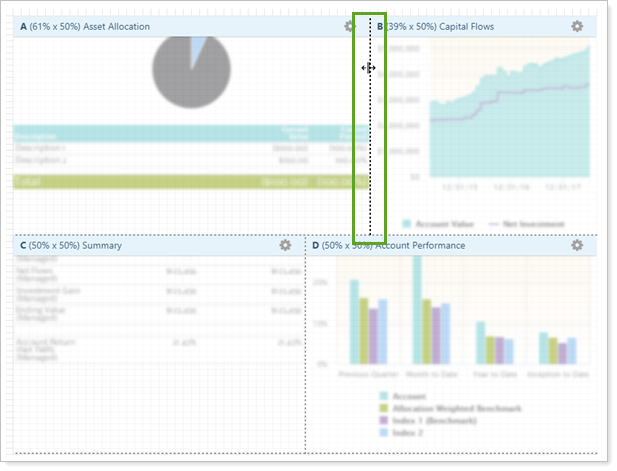
>> User-Friendly Settings Layout
You'll see all the same report settings as before, now displayed in a more organized and accessible way.
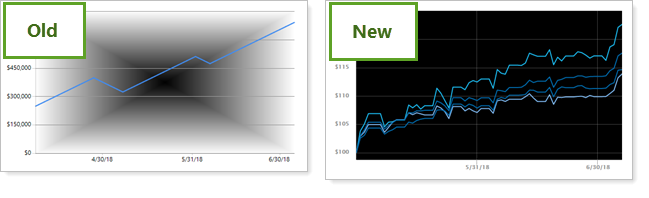
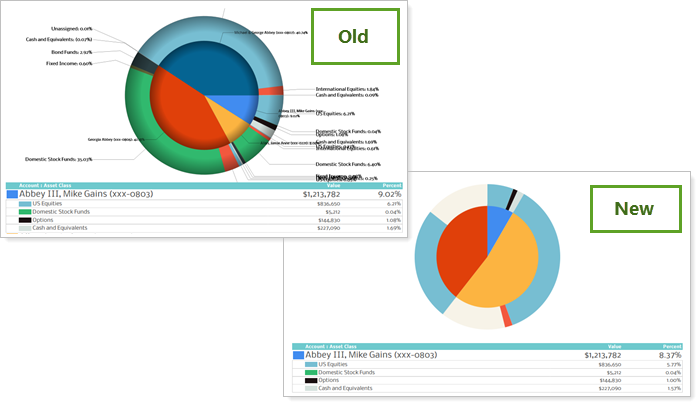
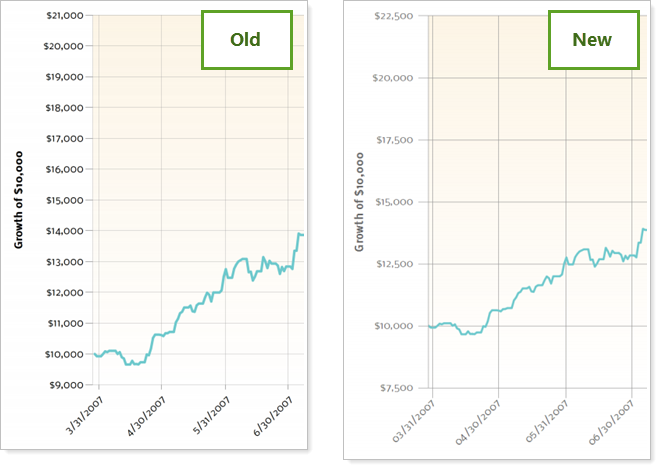
New Look for PDF Charts
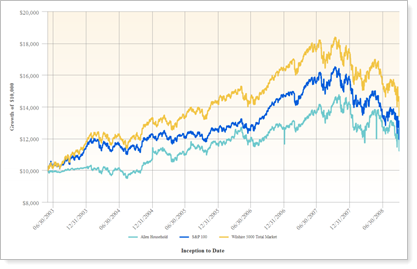
In order to maintain the high quality PDF reporting you've come to expect, we slightly modified the appearance of charts in PDF reports. We think you and your clients will appreciate this cleaner, more modern look for PDF charts, which matches what you see on dynamic reports.
Note that:
-
No action is required. These changes take place automatically.
-
All your site theme settings remain the same. There is no change to theme-related style choices, only to how charts are drawn.
Important
While PDF charts are rendered using the same hex codes, you may notice that colors look slightly differently on the new PDF charts.
The following are some of the changes you may notice:
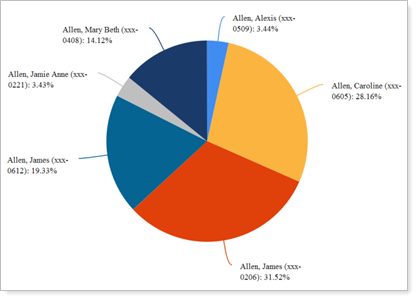
Pie Charts
- Cleaner, more modern style
- Start at 12 o'clock
Allocation Over Time Chart
- Cleaner, more modern style
- X- and y-axes start at 0, removing negative values
- Category organization easier to interpret
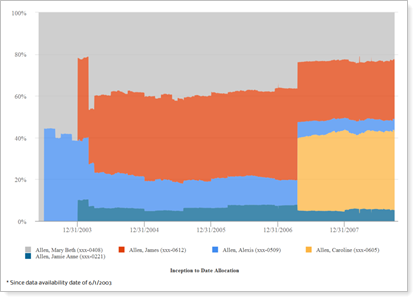
In PDF reports, this chart is sampled at the following rates:
- When plotting 0 to 10 years on the x axis: Sampled every 1 day
- When plotting 10 to 20 years on the x axis: Sampled every 7 days
- When plotting 20+ years on the x axis: Sampled every 30 days
Line Charts
Follows the site theme for line gradients.
In PDF reports, this chart is sampled at the following rates:
- When plotting 0 to 10 years on the x axis: Sampled every 1 day
- When plotting 10 to 20 years on the x axis: Sampled every 7 days
- When plotting 20+ years on the x axis: Sampled every 30 days
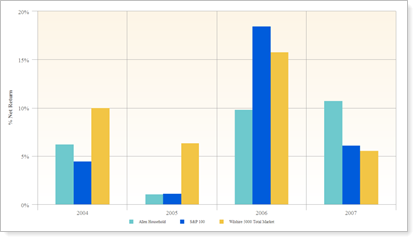
Bar Charts
Cleaner, more modern style.
Other Changes to the Look of Charts
-
Gradient Replaces 3D. All charts now start without shading. To add shading, select the new Gradient chart check box. Gradient chart replaces the old 3D chart option, and all charts currently set to display as 3D will be displayed with a gradient instead.
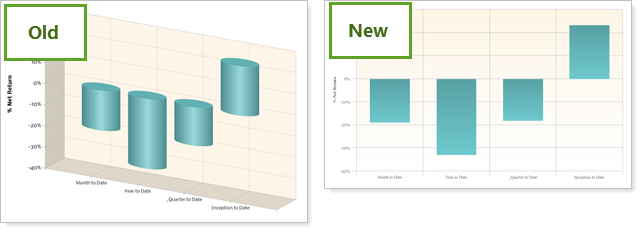
-
Center Gradient Removed. For all reports, if you use a gradient theme set to Center, that chart will be transitioned to no gradient. This matches how dynamic charts look.
-
Group By Asset Allocation Pie Chart Labels Removed. When you Group By on the Asset Allocation report, the chart displays a pie within a pie. You'll notice that new charts exclude labels for those pie-within-a-pie charts. This enhances readability.
-
PDF x- and y-axis tick marks match dynamic reports. You may notice that when you compare the x- and y-axes for previous PDF charts with new charts, the range and tick marks may vary slightly. This change ensures that axes on PDF charts and dynamic charts match.
Account Templates for New Accounts
Opening new accounts can be a pain. There are forms, signatures, and paperwork, and once the account is finally open, the last thing you want to do is take time setting up new accounts in Tamarac. We listened and we're pleased to announce a new feature that can reduce new account set-up time: account templates.
You can speed up your new accounts workflow by first establishing account settings in your firm's default account template. Those settings are applied automatically when new accounts come in. Then you can adjust that account's individual settings further as needed, such as defining the account's taxable status or adding an account type.
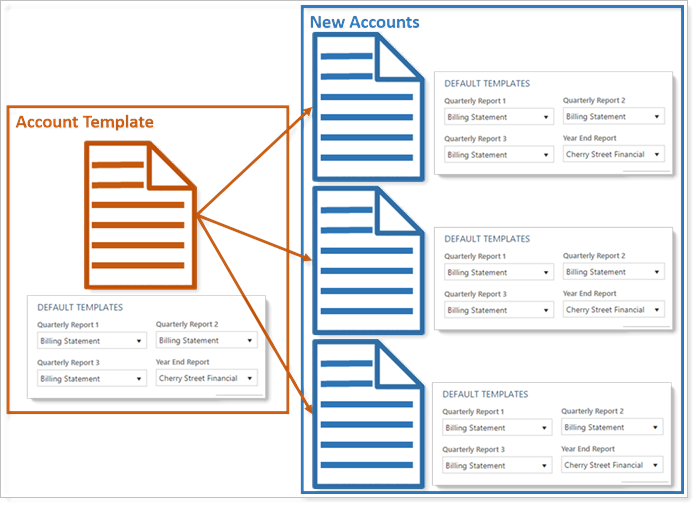
To establish your default account template, select Account Templates in the Setup menu and click Edit. This opens a slide-out pane with account settings that you're probably familiar with. When you edit the default account template, any account settings you don't change during the edit will remain the same; a save won't overwrite those settings.
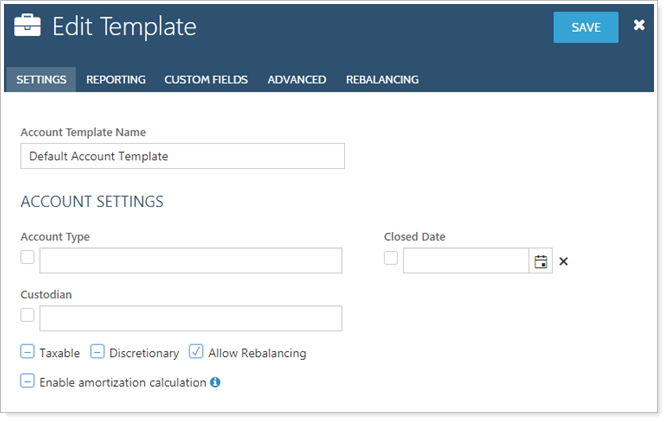
You can specify any of the available settings in your default account template.
important
Only admin users may view or update the default template.
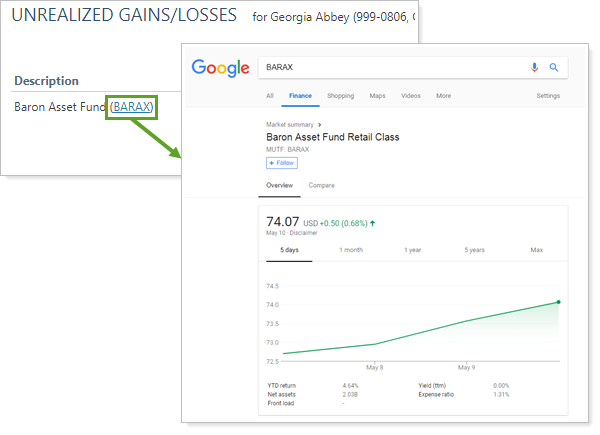
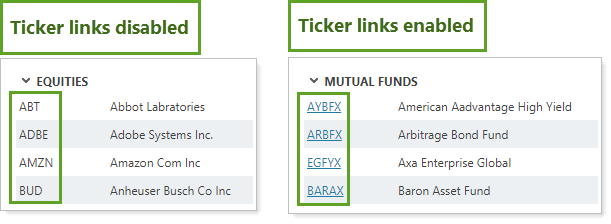
Toggle Report Ticker Links On or Off
On some dynamic reports, you'll notice that when you include the column for the ticker symbol, the symbol is a link that takes you to Google Finance details for that security.
You can enable or disable links for each security type on a type-by-type basis. This allows you to:
-
Disable links. If you prefer to keep your users within Tamarac, you can disable external linking for each security type.
-
Enable links. If you'd like to make sure users can quickly access Google Finance data, you can enable external linking for each security type.
-
Enable some links. If you're fine with having some securities link externally, but prefer to keep other securities from linking, you can set that for each individual security type.
To enable or disable ticker links for specific security types, on the Setup menu, under Security Settings, click Category. In the Security Type row, click Edit Categories. Click Edit next to the security type you want to edit and then set Ticker Links to Enabled or Disabled.
Ticker links are enabled by default for all categories except indexes.
Reporting
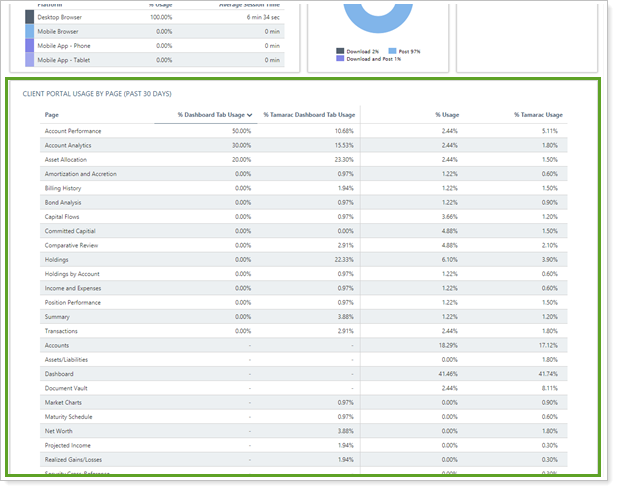
Track Client Portal Dynamic Report and Page Usage
When you build a client portal view, you want to give clients access to meaningful data. But it can be difficult to know what reports and pages clients find useful and which they ignore. Do clients prefer the Transaction report or the Holdings report? Do they ever look at the Capital Flows report? We heard loud and clear that you want access to this type of information.
Allow us to introduce the new Client Portal Usage By Page widget on the Utilization report. This widget, which uses Google Analytics to rank dynamic reports by percent usage, answers questions such as:
-
What reports do my clients look at the most? The % Usage column displays the pages viewed by your clients when they visit their portals, ranked in order of most to least viewed.
-
What reports do other Tamarac firms use? The % Tamarac Usage column displays which reports are most popular with clients across all firms using Tamarac. Use this column to get ideas for reports your clients might find useful.
This widget only shows data for your clients. It does not show how advisors within your firm use reports.
See How Entities Are Connected With the Relationship Diagram
With all the different connections between accounts, groups, Households, and clients in Tamarac Reporting, it's easy to lose track of how different entities relate to each other. If you've ever felt like you need to draw a picture just to map out all these connections, you'll be happy to hear about our new relationship diagram.
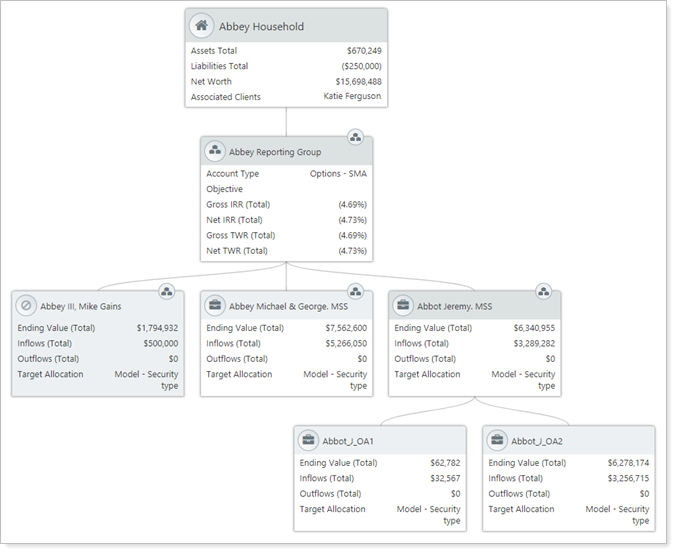
This diagram helps you answer questions such as:
-
How does this account or group relate to other entities?
-
What accounts and groups are members of this Household?
-
What clients are part of this Household, and which accounts belong to which clients?
For example, let's say you're looking at a Holdings report and you notice some unique holdings you didn't expect to see in that group. You wonder why those particular holdings are showing up. The first step in troubleshooting is to confirm which accounts are members of the group.
To quickly check group membership, click the  button next to the Find Data For list. This opens the relationship diagram for that group, establishing that the group holding those unique securities (marked in green) is a direct member of the group you're looking at.
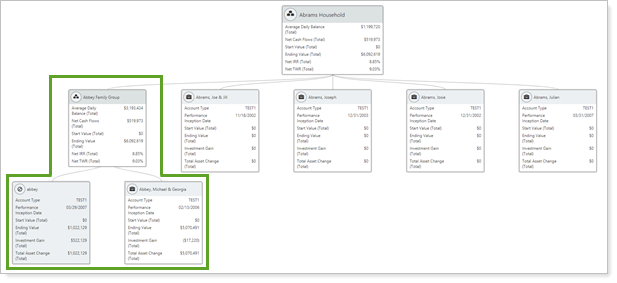
You can access the relationship diagram on the Reports menu under Global Reports or using the button next to the Find Data For list.
Permissions
The relationship diagram itself is permissionable. If you don't have permission to see the diagram, you won't see the button.
Administrators automatically have access to the diagram. Other users can be granted permission to access this feature under Roles > Reports | Relationship Diagram.
Additional Fields for Household Information Bulk Report
As part of our commitment to streamlining your work processes, we've made it easier than ever to get access to the Household information you need, in the format that works best for you. The following fields, which were previously only available on the Households page, are now available for export in the Household Information bulk report:
|
|
For more information on bulk reports, see Bulk Reports.
Integrations
Enhance Productivity With LifeYield Integration
If your firm uses LifeYield, you know the value of optimizing: You do it for your clients already. That's why you'll be excited to learn that we've added an integration with LifeYield that will help enhance your productivity and improve your LifeYield results. The integration includes the following:
-
 Single Sign-On (SSO) From Tamarac to LifeYield Streamline your processes by reducing time spent logging in between systems. To access LifeYield from Tamarac, hover your mouse over your name at the top of the page and click LifeYield.
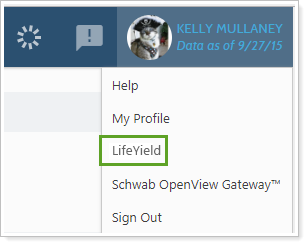
-
Import Tamarac Data into LifeYield When enabled through LifeYield, see Tamarac groups, accounts, positions, position category, and balances directly in LifeYield.
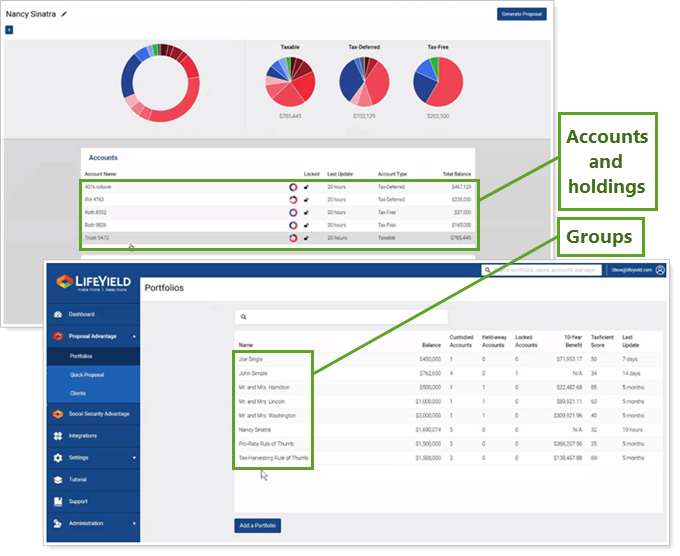
If you would like this feature enabled for your firm, you must be approved to use the Tamarac API. If you do not have access to the API, please contact Account Management at TamaracAM@envestnet.com.
Learn More - Watch the Release Video