
Contents
|
Why Use the Utilization Report? See the Utilization Report in Action Features of the Utilization Report Switch Between Business Intelligence Reports Review Data for Account Sets Only |
Introduction
| Applies to: | |||
|---|---|---|---|
| ✔ Dynamic | Mobile | Client Portal | |
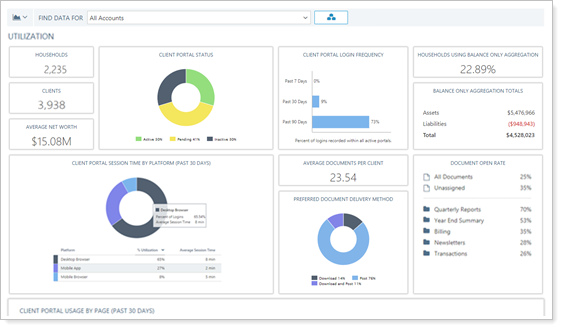
The Utilization report displays a fixed set of widgets that show data about the Tamarac Reporting features your clients are using. It helps you see:
-
Client portal usage
-
Document vault usage
-
Asset and liability usage
The report quantifies and displays these metrics based on account sets. This allows you to see usage split out by advisor, client tier, client age bracket, or any other grouping you choose to make an account set for.
Note
Utilization data comes from legacy Client Portal data only.
Access the Utilization Report
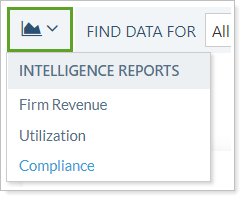
To access the Utilization report, on the Reports menu, under Intelligence Reports, click Utilization.
What each user sees depends on what accounts and Households they have permission to view. You will only see data for accounts and Households on the report that you have access to.
Administrators automatically have access to the report. Other users can be granted permission to access this feature under Roles, then Reports | Utilization.
Why Use the Utilization Report?
The Utilization report collects advisor and client data to help you answer usage-related questions such as:
-
Are my clients using the client portal? See metrics about client portal usage, including:
-
What percentage of clients have portals enabled?
-
What percentage of clients have visited the portal within certain date periods?
-
How do clients access the portal—through the mobile app or a web browser?
-
How long do clients spend on the portal?
-
-
How Many Clients and Households Does an advisor have, and what net Worth do they have? Create account sets for each advisor in the firm and use the Utilization report to see number of clients, Households, average net worth on an advisor-by-advisor basis, and more.
-
How do my clients prefer to receive documents? Are they using the document vault? Review how clients are set to receive documents—post, download, or download and post—and the percentage of documents opened for each folder.
See the Utilization Report in Action
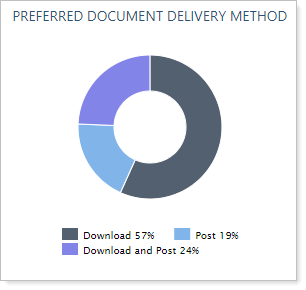
Cherry Street Financial wants to encourage clients to use the client portal for sharing files. Using the Utilization report, Cherry Street establishes that only 19% of clients prefer to prefer to receive their documents via the portal currently. An additional 24% of clients receive documents via the portal, but also want hard copies. That leaves 57% of clients receiving hard copies of their documents.
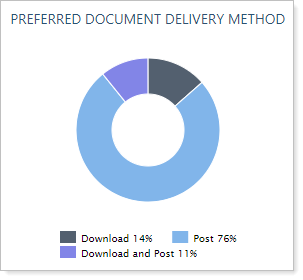
For the next six months, Cherry Street makes a concerted marketing effort to encourage clients to use the portal for receiving and sending files to advisors. At meetings, advisors emphasize to clients the document vault's security, reliability, and ease of use for file sharing. As clients agreed to go paperless, their Preferred Delivery Method was updated.
After the marketing push ended, Cherry Street advisors run the Utilization report. It shows a substantial change in adoption, with 76% of clients agreeing to receive documents via the document vault.
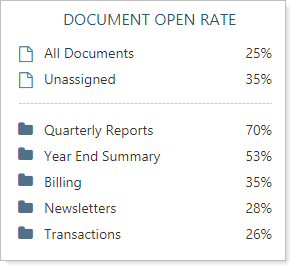
The Document Open Rate section helps confirm that clients are actually opening files through the document vault.
Features of the Utilization Report
The dynamic report offers the following features.
Switch Between Business Intelligence Reports
Use the report switcher to quickly navigate between business intelligence reports.
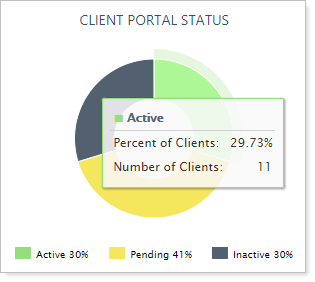
Use Tooltips to See Details
Hover over a data point to see details.
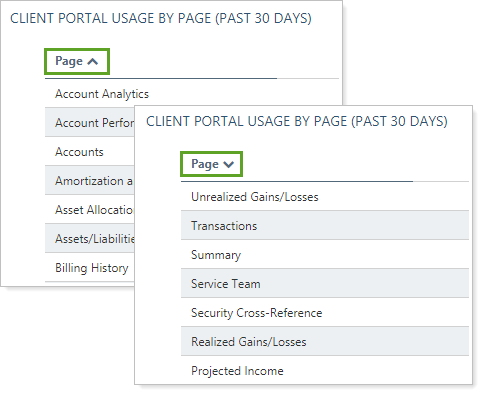
Sort Columns on the Fly
Sort columns by clicking column headers. The caret direction (^ or ˅) indicates sorting order, either ascending or descending.
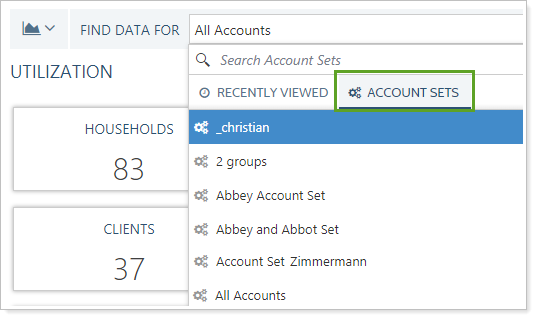
Review Data for Account Sets Only
When you use the Utilization report, you'll notice that the Find Data For list only displays the Account Sets tab. By default, the report displays the All Accounts account set, but you can review data for any existing account set. For more information on account sets, see Group Accounts Into Account Sets.
Create a Utilization Report Dashboard View
There is no Utilization report dashboard report available.
Utilization Widget Details
The Utilization report displays data based on your user's permissions. The report does not include any configurable settings.
When reviewing metrics, client portal usage metrics reflect only actual client logins. Advisor logins or logins when viewing as client are excluded from these metrics.
In this report, you'll find the following usage details aggregated:
| Widget | What It Displays |
|---|---|
| Households |
The total number of Households you can access. |
| Clients | The total number of clients visible to you regardless of Household assignment. |
| Average Net Worth | Average net worth of all Households you can access. |
| Client Portal Status | The percentage of each client portal status type—active, inactive, or pending—from the Clients/Client Portals page. |
| Client Portal Session Time by Platform (Past 30 Days) |
The amount of time your clients have spent on the portal, broken down by platform type, such as mobile app and desktop browser. |
| Client Portal Login Frequency |
The percentage of clients with an Active portal status that have logged in within the last 7 days, 30 days, and 90 days. |
| Average Documents Per Client | The average number of documents posted to and from a client. |
| Preferred Document Delivery Method | The percentage of clients with each of the Preferred Delivery Method types selected on the Client Portal panel. |
| Households Using Balance Only Aggregation | The total number of Households that include assets or liabilities, either manually entered or linked through Yodlee. |
| Balance Only Aggregation Totals | The sum of all assets, the sum of all liabilities, and the total value of all assets and liabilities. Includes both Yodlee-linked and manually-entered assets or liabilities. |
| Document Open Rate |
The percentage of documents within each folder that have been opened in the last rolling 12 months. Tamarac displays open rates for the following document vault document folder assignments:
The open rate begins calculating as of February, 2018. Documents posted before that date are not included in the rate. Example: Files Shared With Different ClientsA folder contains two files. File 1 is shared with one client. File 2 is shared with 19 clients. In this case, a Document Open Rate of 100% means that 20 out of 20 clients looked at the files: the one client looked at File 1 and all 19 clients looked at File 2. If only one client looks at File 2, then 1 out of 20 clients opened the files. This results in a Document Open Rate of 5%. |
| Client Portal Usage by Page (Past 30 Days) |
The percentage breakdown of what reports and tabs your clients look at on the client portal, with overall Tamarac data for comparison. Statistics are aggregated periodically, so individual sessions may not be reflected in the statistics.
Displays:
|
Report Actions
To learn more about reports in Tamarac, see Introduction to Reports.
To learn more about how to generate a report, change the data displayed, print or export the report data, and more, see Basics of Working With Reports.
To learn more about creating and using PDF reports, see Understanding PDF Reports and Workflow: Generate a PDF Report.