
Contents
|
How Show as Allocation Over Time Works |
How Show as Allocation Over Time Works
| Applies to: | ||
|---|---|---|
| ✔ Dynamic | ✔ Client Portal | |
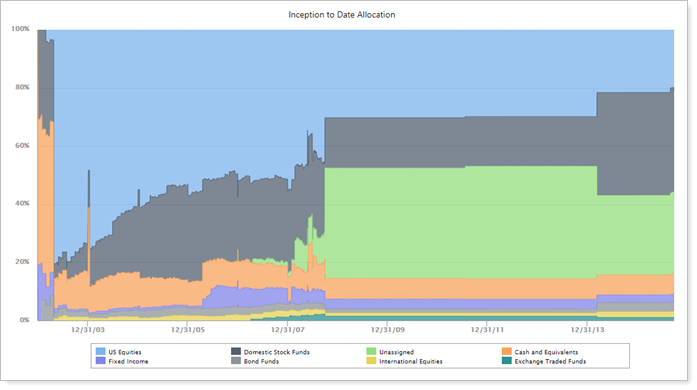
This setting allows you to display the data on the Asset Allocation report color-coded chart that represents the proportion of each category held at a specific time.
The allocation over time chart shows strategy change over the selected date period. This is an especially useful chart when used in conjunction with other reports, such as Account Performance report, which can together show when allocation changed—perhaps after a rebalance—and the impact that change had on performance.
In Dynamic Reports

Data are based on Date Period. The category order is determined by the order you set up in Categories.
In PDF Reports
This setting behaves the same on PDF reports as on dynamic reports, but on the PDF report, you set the specific date period.
On the PDF report, the following additional chart settings are available:
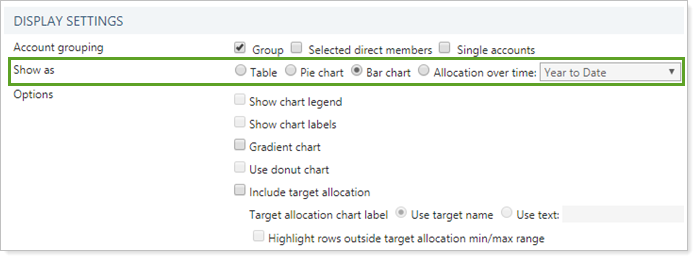
Allocation Over Time (Date Period)
Since the PDF report is run based on the date you select, when you choose to display the Allocation over time chart, you also designate the date range to display.
Date Periods
In PDF reports, the date in date periods that go to Date is the as-of date for the report. For example, if on 4/20/2015 you run a quarterly report with an As-of Date for 3/31/2015, the Year to Date date period will be 1/1/2015 to 3/31/2015.
Date ranges are determined by the firm's Date Periods.
Reports With This Setting
Holdings ReportsPDF-Specific Reports
Related Settings
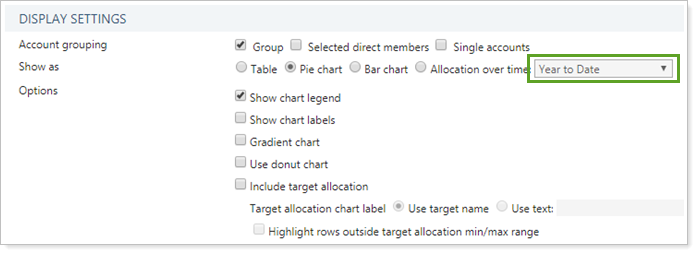
This is one of the Show as options for the Asset Allocation report. The other options are: