
Contents
How Show as Bar Chart Works
| Applies to: | ||
|---|---|---|
| ✔ Dynamic | ✔ Client Portal | |
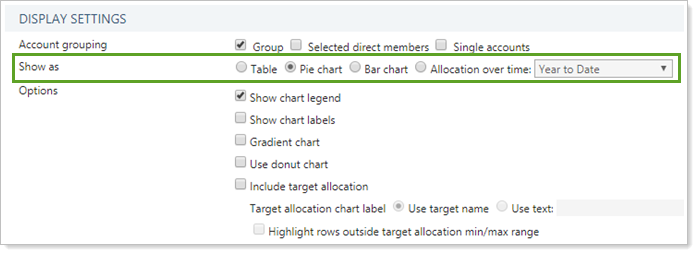
This setting allows you to display the data on the Asset Allocation report in a bar chart.
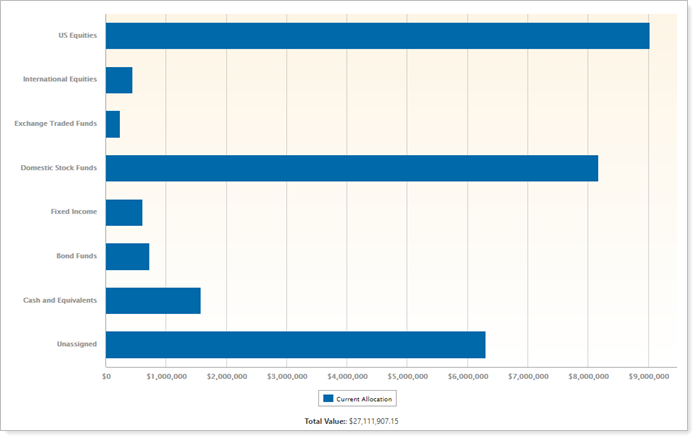
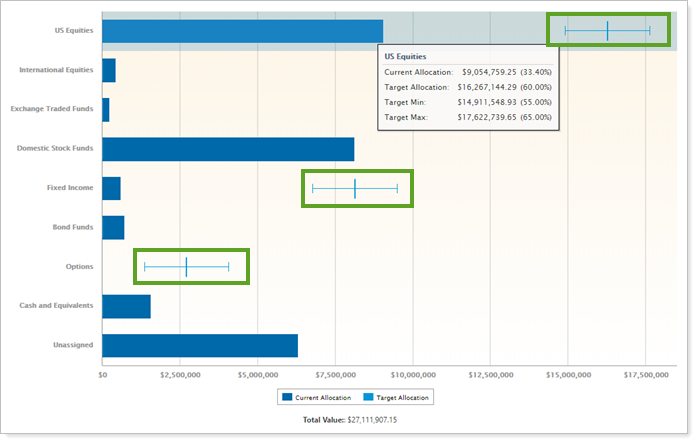
The bar chart is a snapshot showing the allocation in the account or group at a single point in time. It emphasizes amount of holdings in each grouping. This is an especially useful chart when comparing current allocation to target allocation.
In Dynamic Reports

-
When Include target allocation is selected, you will see the target value marked with error bars indicating the target maximum and minimum.
Data are based on As of Date.
In PDF Reports
This setting behaves the same on PDF reports as on dynamic reports.
When you add a table to the PDF report, the following additional settings are available:
Reports With This Setting
Holdings ReportsPDF-Specific Reports
Related Settings
This is one of the Show as options for the Asset Allocation report. The other options are: