Contents
|
Track Client Portal Dynamic Report and Page Usage See How Entities Are Connected With the Relationship Diagram Export Billing Details From the Firm Revenue Report |
Reporting
Track Client Portal Dynamic Report and Page Usage
When you build a client portal view, you're trying to give clients access to data they find meaningful. But it can be difficult to know what reports and pages clients find useful and which they ignore. Do clients prefer the Transaction report or the Holdings report? Do they ever look at the Capital Flows report? We heard loud and clear that you want access to this type of information.
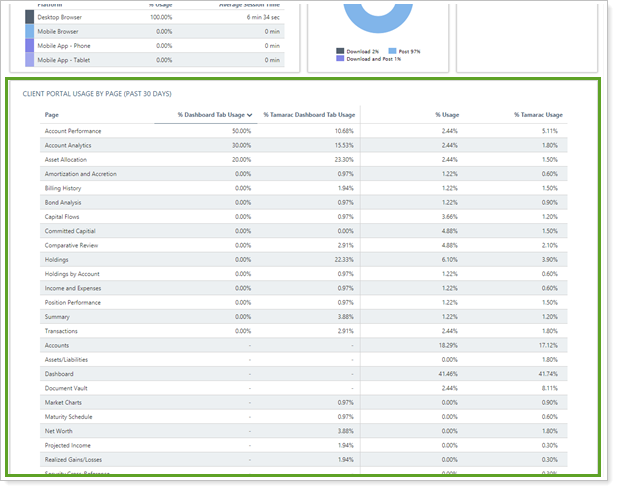
Allow us to introduce the new Dynamic Report Utilization widget on the Utilization report. This widget, which uses Google Analytics to rank dynamic reports by percent usage, answers questions such as:
-
What reports do my clients look at the most and least? The % Utilization column displays the pages viewed by your clients when they visit their portals, ranked in order of most to least viewed.
-
What reports do other Tamarac firms use that we could consider for our firm? The Tamarac % Utilization column displays which reports are most popular with clients across all firms using Tamarac. Use this column to get ideas for reports your clients might find useful.
This widget only shows data for your clients. It does not show how advisors within your firm use reports.
See How Entities Are Connected With the Relationship Diagram
With all the different connections between accounts, groups, Households, and clients in Tamarac Reporting, it's easy to lose track of how different entities relate to each other. If you've ever felt like you need to draw a picture just to map out all these connections, you'll be happy to hear about our new relationship diagram.
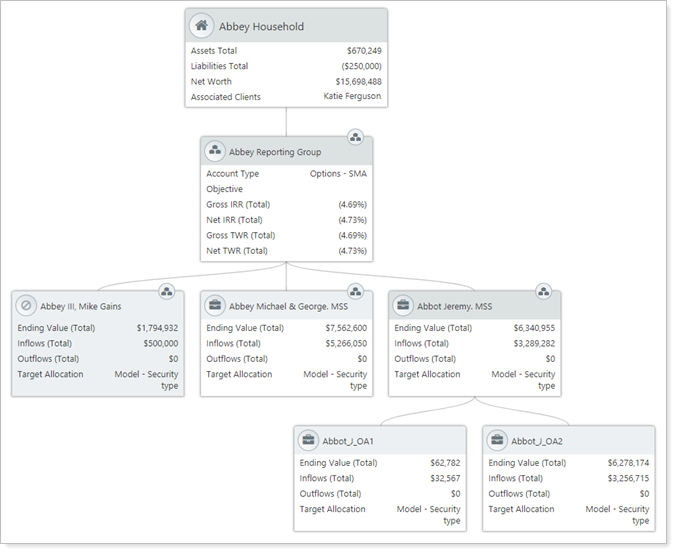
This diagram helps you answer questions such as:
-
How does this account or group relate to other entities?
-
What accounts and groups are members of this Household?
-
What clients are part of this Household, and which accounts belong to which clients?
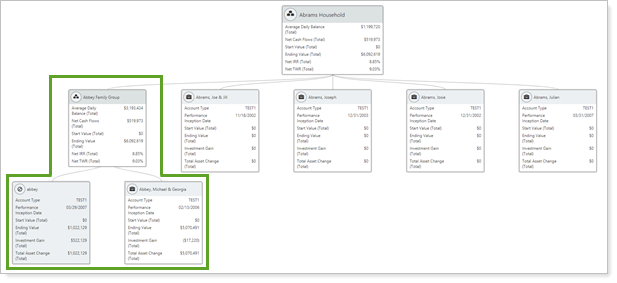
For example, let's say you're looking at a Holdings report and you notice some unique holdings you didn't expect to see in that group. You wonder why those particular holdings are showing up. The first step in troubleshooting is to confirm which accounts are members of the group.
To quickly check group membership, click the  button next to the Find Data For list. This opens the relationship diagram for that group, establishing that the group holding those unique securities (marked in green) is a direct member of the group you're looking at.
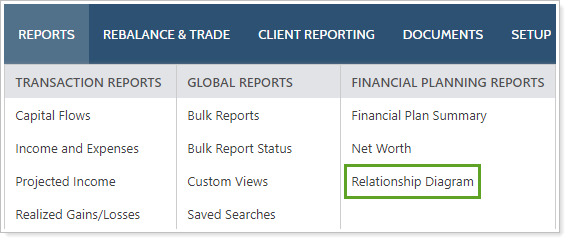
You can access the relationship diagram from two places:
-
On the Reports menu, under Global Reports. This opens the full report with configurable settings.
-
On any page with the Find Data For list, click the
 button next to the list. This opens the abbreviated report and allows you to select from among pre-configured views.
The relationship diagram itself is permissionable. If you don't have permission to see the diagram, you won't see the button.
Administrators automatically have access to the diagram. Other users can be granted permission to access this feature under Roles, then Reports | Relationship Diagram.
Export Billing Details From the Firm Revenue Report
Have you ever wished you could quickly export a detailed record of where billing values came from within Tamarac Reporting? Maybe you've wanted to do a firm-wide audit of where revenue comes from. Export Detail on the Firm Revenue report puts detailed revenue data at your fingertips with the click of a button.
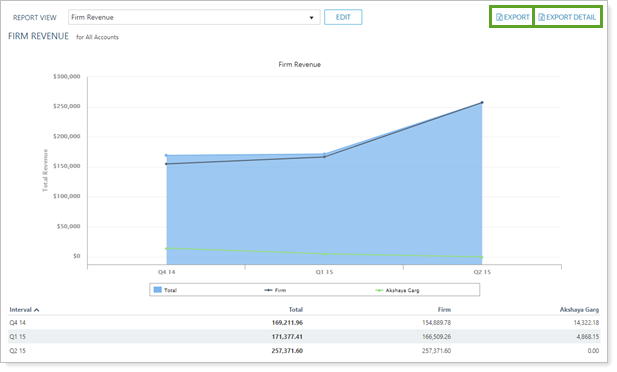
The Firm Revenue report now features two useful new buttons: Export and Export Detail.
-
Export Detail produces a CSV file that includes a comprehensive breakdown of revenue for the periods selected, including billing date, billing group, account, and amount billed for each account.
-
Export produces a simple CSV file of the Firm Revenue report table.
For example, an advisory firm wants to produce a detailed CSV file that they will use for further quarterly revenue analysis. In Q1 2016, their billing included the following:
-
1 bill on 1/31/16 for Billing Group 1 for accounts A ($100) and B ($150)
-
1 bill on 2/10/16 for Billing Group 1 for accounts A ($115), B ($75), and C ($50)
-
1 bill on 2/10/16 for Billing Group 2 for accounts C ($105) and D ($220)
The normal billing export produces one line (for simplicity, this example only reports total revenue in the Total column):
| Interval | Total |
|---|---|
| Q1 2016 | $815 |
Instead of that minimal export, the firm uses Export Detail on the Firm Revenue report to produce the following CSV file:
| Interval | Billing Date | Billing Group Name | Account | Total |
|---|---|---|---|---|
| Q1 2016 | 2/10/16 | Billing Group 1 | A | $115 |
| Q1 2016 | 2/10/16 | Billing Group 1 | B | $75 |
| Q1 2016 | 2/10/16 | Billing Group 1 | C | $50 |
| Q1 2016 | 2/10/16 | Billing Group 2 | C | $105 |
| Q1 2016 | 2/10/16 | Billing Group 2 | D | $220 |
| Q1 2016 | 1/31/16 | Billing Group 1 | A | $100 |
| Q1 2016 | 1/31/16 | Billing Group 1 | B | $150 |
Usability
Include Custom Fields in Household Saved Searches
Saved searches allow you to filter the Households page to show only what you need to see and to hide the extraneous information. Last release, we added Households to saved searches. With this release, we've added Households custom fields as possible saved search filters, dramatically expanding your ability to control exactly what you see on the Households page.
Custom fields in saved searches enable you to refine the accuracy of existing saved searches and saved search dashboard modules, as well as filter the Household page for more effective use of Household custom views.
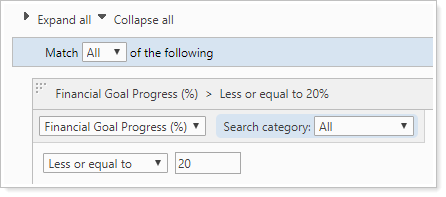
For example, Household saved searches including custom fields allow you to see:
-
Only Households with meeting dates more than one year ago, or meeting dates within the next week or month.
-
Only Households with financial goal percentages within a certain range.
-
Only Households that all work with a specific CPA firm.
-
...and more! It all depends on your custom fields and your firm's needs.
Let's take a look at an example to see exactly how this works.
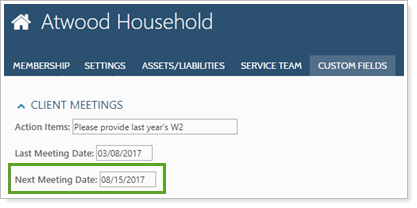
Cherry Street Financial creates Household custom fields for Last Meeting Date, Next Meeting Date, and Action Items. As meetings are scheduled, the dates are entered into the appropriate Household's custom field.
They then create a saved search with a filter for the Next Meeting Date custom field and display all matching Households that have meetings within the next 7 days.
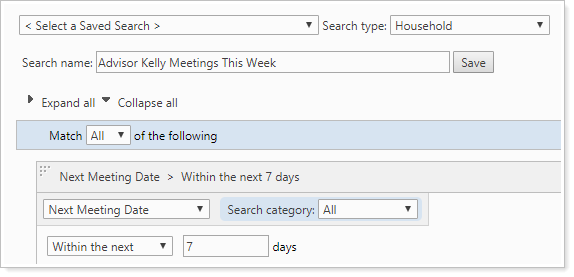
Finally, when it's time to review upcoming meetings, Cherry Street users use that saved search to filter the Households page.
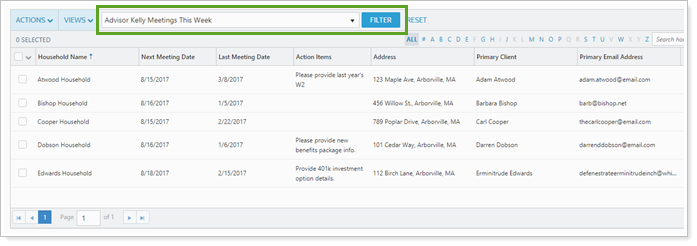
Cherry Street has a Household view set up to display details useful for meetings, including custom fields for Next Meeting Date, Last Meeting Date, and Meeting Action Items, as well as the name, mailing address, and email address of the primary client.
This makes it easy to see when the next meeting is, what actions to remind the client to take before the meeting, and contact information for who to send reminders to.
Support & Training Center
New Tamarac University Online
We’re pleased to announce the next generation of Tamarac University Online! Over the years, thousands of advisors from around the country have attended in-person training through Tamarac University. Our product experts took the same material taught in our in-person courses and enhanced it for self-paced, online learning. These online lessons are a great way for new users to get complete product training or for experienced users to refresh their knowledge.
The new Tamarac University Online delivers:
-
Over 16 hours of e-learning content for each product.
-
White belt and green belt training certifications.
-
User-driven, role-based training that allows learners to focus on what matters most.
-
Training built around common workflows like quarter-end reporting and managing new accounts and securities.
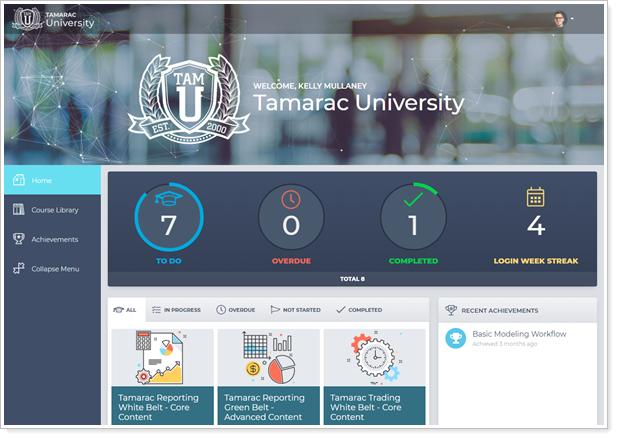
To access the new content, click Tamarac University in the Support & Training Center.
Learn More - Watch the Release Video
