Contents
|
New Business Intelligence Report: The Utilization Report See Dividends Paid on the Committed Capital Report Add Custom Fields to Household Views Quickly Locate Related Data in the Find Data For List |
Reporting
New Business Intelligence Report: The Utilization Report
We're excited to introduce the Utilization report. With this new report, we shine a light on Tamarac usage metrics for both your firm users and your clients. The next in our new Business Intelligence report lineup, the Utilization report answers the following type of questions:
-
Client Portal Usage: How often do my clients visit their portals, and how long do they stay? How do my clients access their portals?
-
Household Statistics: How many Households and clients do I have, and what is their average net worth? How many accounts are brought in manually or through third-party aggregators like Yodlee?
-
Document Vault Usage: On average, how do my clients prefer to receive their documents? How many of my clients view files in their document vaults?
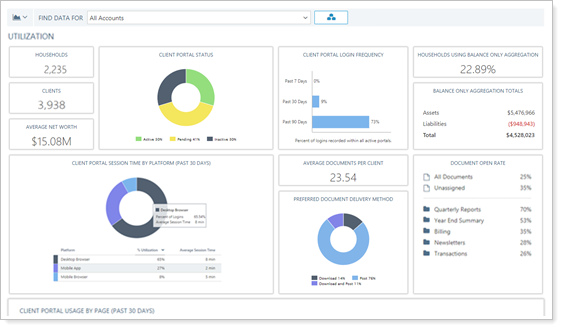
This report only displays data for account sets, including the All Accounts account set. It displays customized statistics for each firm user based on the Households and clients they have permission to see and the account set selected.
The Utilization report does not include editable views or configurable settings. All users see the same tiles with data displayed based on user permissions.
You can find the Utilization report on the Reporting tab under Intelligence Reports.
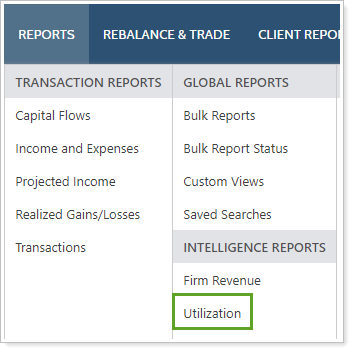
The report itself is permissionable, allowing your firm administrator to determine which users see it.
See Dividends Paid on the Committed Capital Report
We've added another tool to your toolbox for better monitoring committed capital: dividends paid. With this column added to a Committed Capital report, you can answer such questions as:
-
How do the amount of dividends paid compare with amount of capital committed?
-
Does the amount of dividends paid match the prospectus?

This new column reports on the aggregated value of the Dividends Paid row in the manual security snapshot.
After entering new Dividends Paid in a manual security snapshot, run a 0 day sync to see the data in reports.
For more information about the Committed Capital report and manual security snapshots, see How Manual Security Snapshot Fields Display on the Committed Capital Report.
Usability
 Household Custom Fields
Have you wanted to track specific Household information in Tamarac Reporting but couldn't find an existing field for that information? For example, you might want to track a Household's most recent meeting date or your own in-house financial planning goal progress. Custom fields make this possible.
With Household custom fields, you can:
-
Include custom fields in Household page views.
-
Create bulk reports and upload data sets using custom fields.
-
Edit multiple custom fields at once.
-
Create saved searches based on Household custom fields.
Additionally, unique to Households, you can add custom fields to dashboard tiles using the Household Custom Field Tile. This means you can add custom field-based data points to the client portal dashboard, enhancing client interactions and keeping your hard work at the forefront of clients' minds.
For example, Cherry Street Financial wants to help clients remember the last time they met with their financial advisors and provide a gentle reminder of any outstanding action items each time clients log in to their portals. To do this, they create Household custom fields for display on the client portal dashboard. They complete the following steps.
First, under Custom Fields, they set up meeting-related custom fields and add them to a Meetings custom field section.
Once created, Cherry Street users see the Meetings section and custom fields on each Household's Custom Fields tab.
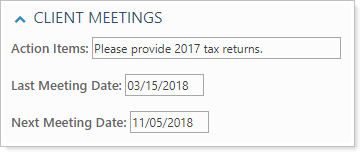
Next, they create a client portal dashboard tile featuring those Meetings custom fields and add it to their existing client portal dashboard.
Finally, they use a Household Informationupload to populate the custom fields for all Households at once.
Now when Cherry Street clients log in to their portals, they see a tile reminding them of the last time they met with their Cherry Street advisor and any outstanding action items.

Coming Later in 2018: See Household Custom Fields in your CRM
For those of you using either Microsoft Dynamics 365 through the Tamarac integration or Salesforce, you'll be excited to hear that Household custom fields will be available for integration with those CRMs later this year. Stay tuned for more details!
Add Custom Fields to Household Views
Last release, we added views to the Household page. Views help you to optimize the Households page columns based on your specific job needs, showing information you use regularly and hiding what you don't. Now you can add even more data points as columns, including columns for each Household custom field.
For example, you can create a Household page view that focuses on client meetings, with columns primarily based on meeting-related Household custom fields:

These new columns are included in the available/selected list when you create a new view on the Household page.
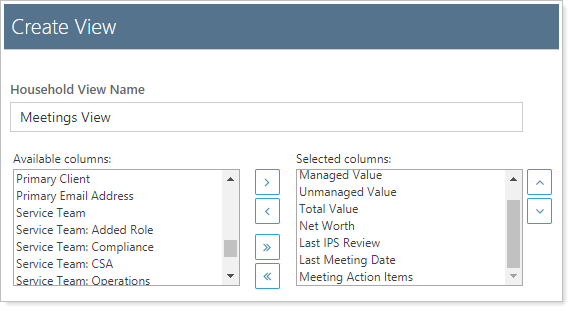
With this release, you could create Household views focused on:
-
Household managementAdd columns such as managed, unmanaged, and total value, Service Team members, and a list of all clients in the Household.
-
Client managementAdd columns such as Client Type and Service Type.
-
Asset managementAdd columns such as assigned model, target allocation, and custodian.
-
Goal ManagementAdd columns such as tracking percent chance of success achieving financial goals.
-
And more!
 Quickly Locate Related Data in the Find Data For List
Your time is valuable. That's why, with this release, we help you find information a little quicker in the Find Data For list. Instead of typing in a search and then clicking on the corresponding item, when you want to see an record that's related to your current result, you'll find it automatically listed in the Find Data For Related tab.
As its name implies, the Related tab shows you accounts, groups, and Households that are directly or implicitly related to the current search result. This eliminates the need to manually search for other related accounts, instead making them accessible with just a couple clicks.
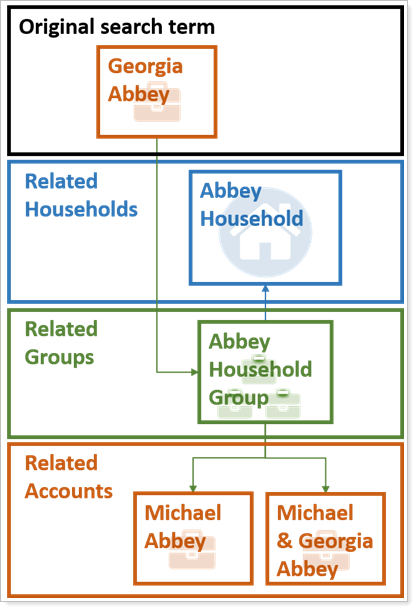
For example, the Abbey Household contains the Abbey Household Group. The Abbey Household Group contains accounts for Georgia Abbey, Michael Abbey, and Georgia & Michael Abbey.
When the Find Data For list displays data for Georgia Abbey, the Related tab displays Abbey Household, Abbey Household Group, and accounts for Michael Abbey and Georgia & Michael Abbey.
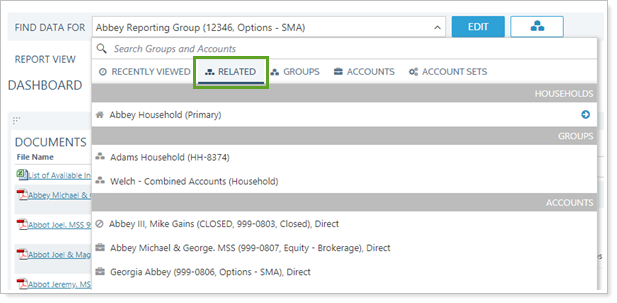
These entities are displayed because they are all related to the Georgia Abbey account, as illustrated below:
Your clients will see this same tab when they log in to their client portals, but it will show only accounts and groups for the Household associated with that portal.
Minor Changes to the Mobile App Look and Feel
When you and your clients log in to the mobile app, you may notice some slight changes to the look and feel of the app. These changes, such as differentiating dashboard tiles better, are designed to enhance the mobile app user experience.
Learn More - Watch the Release Video
