Contents
Create Saved Searches Across the Advisor Xi Suite
When you want to locate an account or multiple accounts, consider using a saved search.
Using saved searches, you can look for accounts that meet specific criteria - for example, you can use a saved search to locate accounts that are holding between $1 and $10,000 of IBM. By using saved searches, you can organize daily workflows to monitor accounts that meet your predefined criteria - across your Tamarac products.
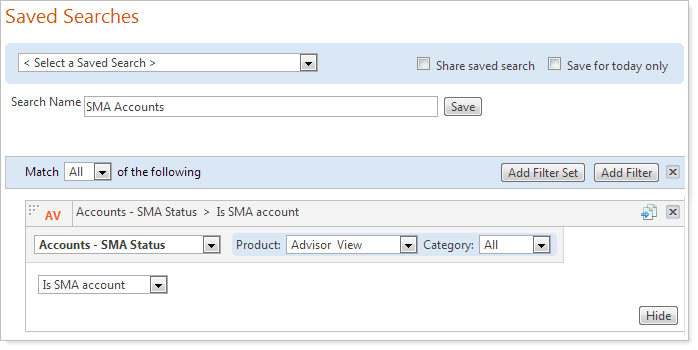
For those of you that use Advisor Rebalancing, we've designed the saved searches in Advisor View to have the exact behavior as your Advisor Rebalancing saved searches.
When you create a saved search, you don't have to fine-tune the search settings the next time you want to use it. Just open the saved search, and you'll see the most current accounts that match the original search.
For example, let's say that each day you want to search for all accounts that have drifted outside of a specified tolerance range. You can build the saved search once and save it. Whenever you want to see the latest accounts that have drifted out of tolerance, you can simply choose the saved search on the Accounts page.

By default, all saved searches you create will be private and only visible to you. If you create a saved search that will be particularly useful to your colleagues, you can share it with others in your firm.
Once you've created a saved search, you can add it to your Advisor View dashboard for easy access.

And those of you that use Advisor Rebalancing will be excited to know that the saved searches you created in Advisor Rebalancing will be accessible from Advisor View. You can even "pull in" information from Advisor Rebalancing to create your saved searches. This new search capability allows you to gain deep insights into your business.
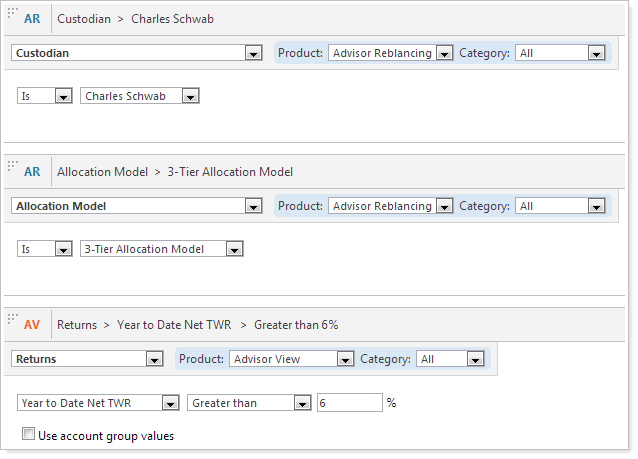
For example, you can create a search that looks for:
-
Accounts that are custodied at Schwab (Advisor Rebalancing)
-
Accounts that are assigned to your 3-Tier Allocation model (Advisor Rebalancing)
-
Accounts that have a return of 6 percent or more (Advisor View)
Advisor View With Schwab OpenView Gateway® Integration
Provide your clients with a higher level of service while driving greater efficiencies within your business.
Envestnet | Tamarac has collaborated with Schwab Intelligent Technologies™ to develop meaningful integration of critical client data from Schwab Advisor Center® within Advisor View.
Real-time client data includes:
-
Account Overview
-
Account Holders & Contacts
-
Trade Confirmations
-
Statements
-
Tax Documents
-
Account Balance Data
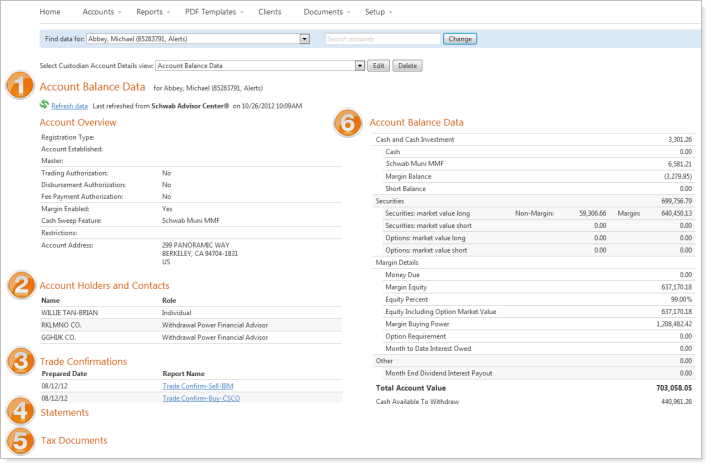
The integration of critical client data from Schwab Advisor Center within Advisor View also includes access to current custodial alerts.

Before you can enable Advisor View with Schwab OpenView Gateway® Integration, please contact Account Management at TamaracAM@envestnet.com, as paperwork is required to enable this functionality for your firm.
Designate Any Symbol As Cash
With this release, you can now designate any ticker as "cash" for your firm - for example, you can set position traded money market funds as cash and then hide the return information on your reports, as shown in the picture below.

In addition, the symbols designated as “cash” are included in the current cash totals on Billing History report and the Accounts page.
To add a symbol as cash, follow these steps:
-
On the Setup menu, click Cash Settings.
-
In the Search Securities box, start typing the symbol that you want to designate as cash. When you see it in the list, click Add.

-
Under Security Return and Category Return, choose how you want to display the return on your reports. For more information on each of the return options, visit Cash Settings.

-
When finished, click Save.
Copy a Client View
Often you may find you want to create a number of similar client views. In most cases, your client views use very similar settings, fonts, colors, reports, etc. Creating these client views from scratch can be tedious, and it's easy to forget to set a particular report setting.
With this release, there's a quick way to create similar client views. You can create a basic client view template and then use the new Save As New option to create each client view.

Faster, More Efficient Synchronization
In an effort to create faster synchronization times, we've made the following changes to the Advisor View sync:
-
Advisor View will no longer calculate performance for Account Sets during the sync process. However, when you view the Account Set, Advisor View will automatically calculate performance if:
-
The account is associated with a portal account
-
The Account Set has less than 20 sub-accounts and Advisor View requires less than 30 days of performance data
-
All the interval data for the underlying accounts is already available
If the Account Set does not meet the criteria above, Advisor View will prompt you to recalculate performance.
-
-
When you calculate performance, Advisor View will no longer prevent you or your clients from signing into the program. However, if you sign in during the sync process, Advisor View will let you know that a sync is in progress.
-
You now have complete control over the accounts and groups for which Advisor View will calculate performance during the sync. If you don't want Advisor View to calculate performance for a particular account or group during the sync, on the Accounts page, select the applicable accounts or groups, and click Edit Performance Settings in the More Actions list.

-
You also have complete control over whether or not you want Advisor View to calculate performance for new accounts during the sync. If you don't want Advisor View to calculate performance for new accounts during the sync, on the Setup menu, click System Settings. Under Account Performance Configuration, clear the Calculate performance during sync for new accounts check box and then click Save.

Custom Start Dates
With the new custom start feature, you can now specify a date that Advisor View begins to show performance or other report data. Strategies change and styles evolve — both are good reasons you might want to exclude old performance from your reports. This new feature may make it easier to analyze performance when market fluctuations are taken in to consideration.
To set up a custom start date, on the Setup menu in Advisor View, click Date Periods. Click To Date period and then enter your custom start date. When finished, click Create to add the custom start date to Advisor View.

Improved PDF Dashboard Report
For those of you who use the PDF Dashboard report, you'll be pleased we've added several new features, including:
-
New report section for Account Analytics
-
New report section for Bond Analysis
-
New report section for Summary by Account
-
Exclude intra-group flows for the Summary section
-
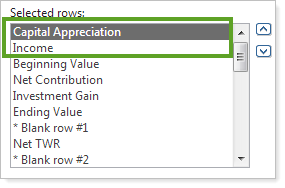
Option to add Capital Appreciation and Income as columns on the Summary section
-
Option to show Asset Allocation without charts
-
Option to show current and/or target allocation on the Asset Allocation section
-
Option to exclude unmanaged assets on the Asset Allocation section
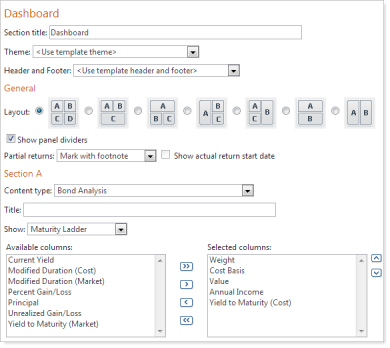
For more information on customizing the PDF Dashboard report, visit PDF Dashboard Report.
Specify the Number of Reports in Each ZIP File When Printing PDF Reports
In previous releases, when printing your PDF reports for multiple clients, Advisor View would allow a maximum of 50 PDF reports in each ZIP file. For example, let's say you print PDF reports for 125 clients. Advisor View would create the following ZIP files:
-
Two ZIP files that contain 50 PDF reports each
-
One ZIP file that contains 25 PDF reports
To reduce the number of ZIP files Advisor View creates when printing PDF reports for a large number of clients, you can now specify the number of report files that Advisor View should add to each ZIP file.

To configure this new option, on the Setup menu, click System Settings. Under PDF Batch Size, choose the number of report files that Advisor View should add to each ZIP file and then click Save.
Overlay Text on Background Images for Headers & Footers
Now you can overlay text on top of the background images on headers and footers. In previous releases, you could add background text, but you were unable to overlay text on top of it.

Rulers & Gridlines for Custom Sections
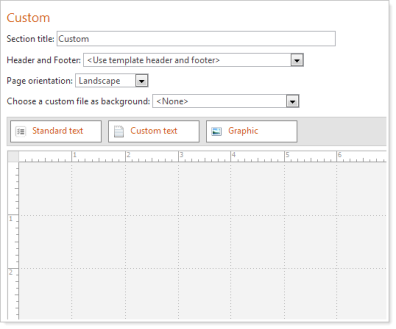
In the June release of Advisor View, we delivered a custom section builder that simplifies the process of creating custom report sections. You can use the custom report builder to create professional cover pages, envelope insert pages, newsletters, personal letters, and more.
We've made the custom section builder easier to use by adding rulers and gridlines. The new rulers and gridlines will come in handy when aligning text and images in your custom sections.
Default As Of Date When Running PDF Reports
When you generate your PDF performance reports, Advisor View will automatically complete the As of date box with the most current market date of your data.

Improved Case Management on the Support & Training Center
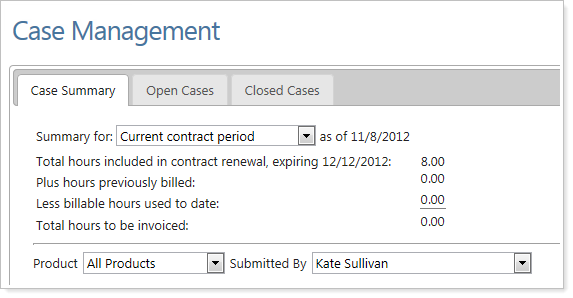
To help you get the most out of your customer support hours, you can now track your hours on the Support & Training Center. To check out this new feature, simply click Help and then click the Case Management tab.
New Columns on Holdings Report: Percent Dollar Gain/Loss & Cash Invested
We've added the following columns to the dynamic and PDF Holdings report:
-
Dollar Gain/Loss
-
Percent Dollar Gain/Loss
-
Cash Invested
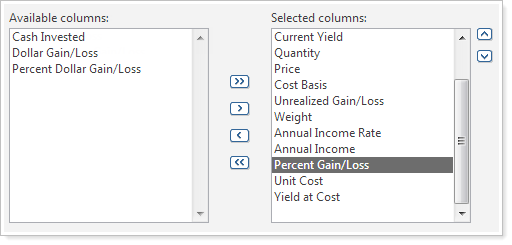
For more information on customizing the Holdings report, visit Holdings Report.
Total for Principal Column on the Bond Analysis Report
We've added totals for the Principal column on the dynamic and PDF Bond Analysis report.

To check out this new feature, simply run the Bond Analysis report. The totals appear automatically.
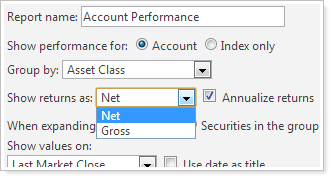
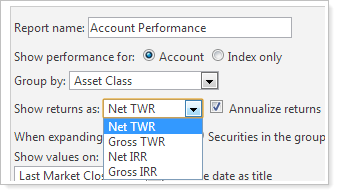
View Internal Rate of Return on the Dynamic Account Performance Report
You now have the option to display the internal rate of return on the dynamic Account Performance report. Before this release, time-weighted return was the only option.
| Before this release... | After this release... |
|---|---|
|
|
Current Cash on Billing History Report
We've added a Current Cash column to the Billing History report so that you can quickly see if a client has enough available cash to pay his or her bill.

Three Decimal Places for Mutual Funds
Mutual fund quantities will now always display with three decimals on your dynamic reports.

