Contents
|
Expand and Collapse All Widgets Account Notes, Trade Reason, and Allocation Charts Widget |
Introduction
The Rebalance Summary offers a user friendly way to review recommended trades and take action on those trades. This page makes good use of available space, giving you a better overall view of the data.
The Rebalance Summary report contains widgets at the top. These widgets let you view at-a-glance information about your rebalances such as cash, gains and losses, previous account activity, and more.
For more information about the Rebalance Summary, see Reading the Rebalance Summary.
Expand and Collapse All Widgets
You can customize the Rebalance Summary to either expand or collapse all widgets with the touch of a button.
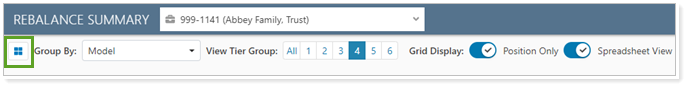
Click  to hide the widgets. Click to
  expand the widgets.
Account Notes, Trade Reason, and Allocation Charts Widget
Use this widget to gain context into the rebalance event and the resulting allocations.
Choose from the following tabs:
-
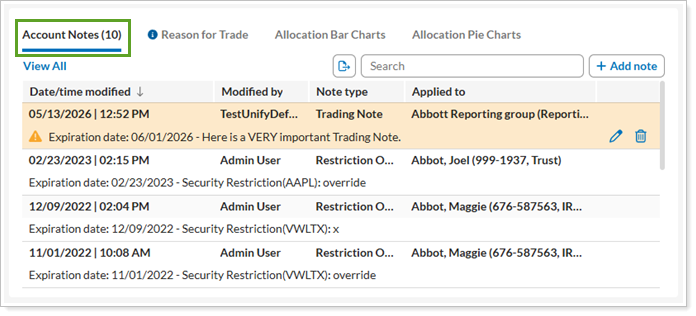
Account Notes. This is the default tab. Search, add, update, and export notes directly.
-
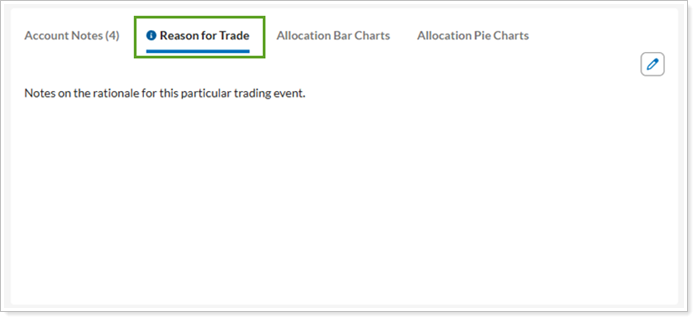
Reason for Trade. View and update the trade rationale.
-
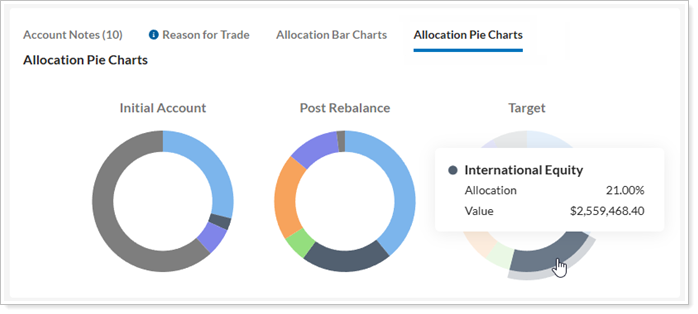
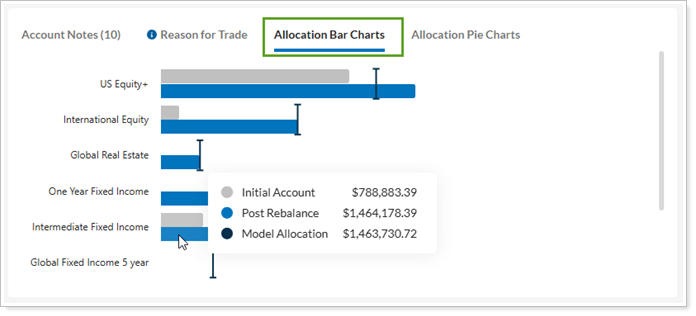
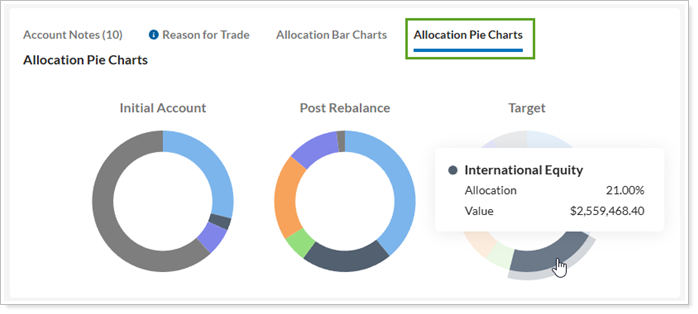
Allocation Bar Charts and Allocation Pie Charts. Visually track an account or group's initial allocation, the anticipated allocation after the rebalance, and the breakdown of the holdings as targeted in the model. Each slice represents a Security Level model. Hover over each slice to see data about that model's allocation. Charts update based on the tier group you're viewing.
Account Information Widget
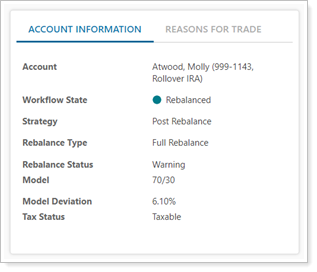
The account information widget gives you summary information about the account or group you're looking at.
You'll see these details:
| Field | More Information |
|---|---|
| Account | Which account you're viewing. This is useful if you're viewing accounts within a group and you want to verify which account you're looking at. |
| Workflow State |
Where the account or group is in the trading workflow, same as you'll see in the Workflow State column on the Rebalance page:
|
| Strategy |
The status of the rebalance process, showing one of these entries:
|
| Rebalance Type | The Default Rebalance Setting assigned to the account. If you're viewing a group, this may say N/A because the underlying accounts may have different rebalance types. |
| Rebalance Status |
The current state of the rebalance, showing one of these states:
|
| Model | The Assigned Model for the account or group you're viewing. |
| Model Deviation | The percentage the account is deviated from the model prior to rebalancing in absolute terms. |
| Tax Status | Shows whether the account is marked as taxable or non-taxable. If you're viewing a group, this may say N/A because the underlying accounts may have different tax statuses. |
| Reason For Trade | Shows notes specifically entered as a reason for trading. For more about this type of note, see Overview of Notes in Tamarac Trading. |
| Total Cash | The total value of cash in the account, including any cash reserves. |
| Total Account Value | The total value of the account, including all positions in the account and any cash reserves. |
| Rebalancing Account Value | The value of the account, excluding any cash reserves. |
| T+1 Cash | The T+1 cash available after a rebalance. This value is calculated as (Initial Cash + Value of Sells settling T+1) – (Value of Buys settling T+1), excluding fees. |
| Commission |
The total amount which will be paid to the broker for trades in equities and ETFs. These commissions are set at the account level using Equity Per Trade Commission Setting and Equity Per Share Commission Setting. |
| Total Redemption Fee |
The total amount that will be charged upon the sale of funds. This is set up on the Fee Schedules page. |
| Custodian Transaction Fee |
The total amount of fees which will be charged by the custodian. This is set up on the Fee Schedules page. |
YTD Realized Gain/Loss Widget
When viewing a taxable account or a group that contains at least one taxable account, this widget shows initial and post-rebalance realized gain and loss amounts. You'll also see a graph of positive capital gains values compared to the value entered in the Annual Capital Gains Tax Budget setting. This chart gives you an at-a-glance view of capital gains taxes for the year to help you make tax-aware trading decisions.
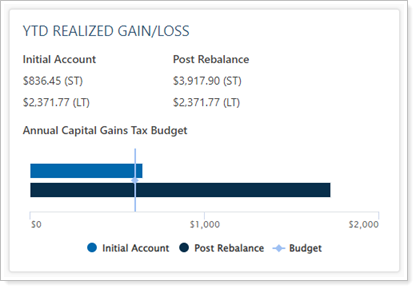
| Field | More Information |
|---|---|
| Initial Account | Shows the YTD short-term (ST) and long-term (LT) realized gains or losses in the account's initial state. |
| Post Rebalance |
Shows what the YTD short-term (ST) and long-term (LT) realized gains or losses would be once rebalanced as shown. |
| Annual Capital Gains Tax Budget |
This graph shows the following:
|
When viewing this widget, you won't see a chart in the following circumstances:
- When viewing a non-taxable account or a group without any taxable accounts.
- If there is no capital gains tax budget set for the account or group you're viewing.
Account Activity, Buys, and Sells Widget
This widget gives you a summary of past trading activities as well as a summary of the recommended trades you'll see in the Rebalance Summary. Use it to see a summary of activities in the account in the past 30 days.
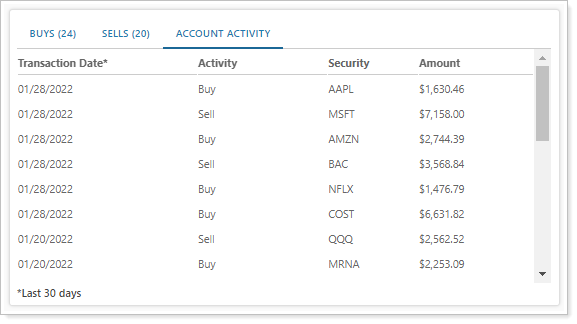
Here, you'll see these activities in the account or group you're viewing:
- Buys
- Sells
- Receipt of securities
- Transfer of securities
- Deposits
- Withdrawals
This widget takes the sum of all buys and sells for a particular security and shows them, along with initial and post-rebalance values. You can view this information in account percentages or dollars using the $ toggle in the top right.
Reserve Summary Widget
Cash and security reserves can be set in individual accounts and allow you to set aside a specified amount of cash for that account. For more information, see Learn More About Cash Management.
The Reserve Summary widget shows an at-a-glance view of valuable cash information you'll need to consider such as reserve goals, cash available to trade, and the cash amount to raise.
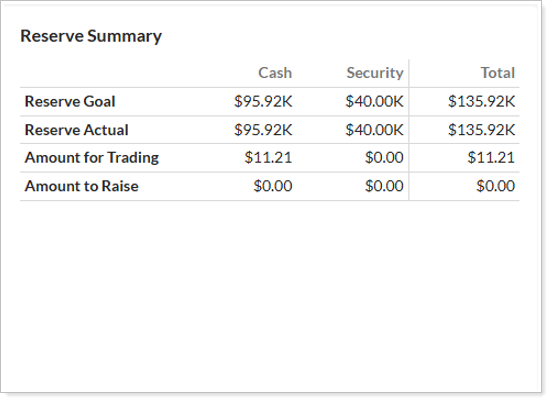
You'll see these details:
| Field | More Information |
|---|---|
| Reserve Goal | The target amount of reserves in cash and securities. This amount reflects the total reserve goal set at the account level. |
| Reserve Actual | The amount of cash and securities held in reserves. This can be different from the goals because of upper and lower thresholds. |
| Amount for Trading | The amount an account has in excess of the target reserves. |
| Amount to Raise | The amount an account needs to raise for reserves. This amount doesn't consider model cash, if any. |
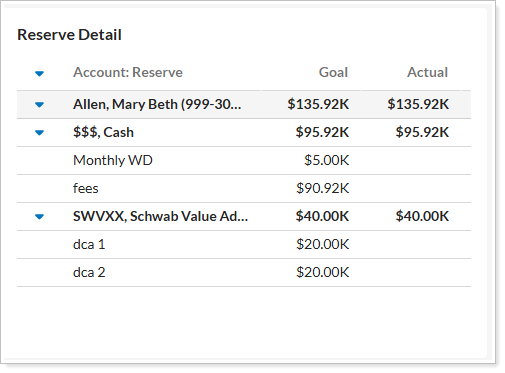
Reserve Detail Widget
The Reserve Detail widget gives you insight into reserves set for the account or group you're viewing. If you're viewing a group, you can see details about reserves set in each underlying account, including goal and actual amounts. The actual reserve amounts are calculated at the account level and do not carry down to the individual reserves.