
Contents
|
Navigate the Rebalance Summary Trading and Account Actions on the Rebalance Summary Edit Trades/Create a Custom Strategy Customize the Rebalance Summary |
Introduction
The Rebalance Summary report is the most frequently used report in Tamarac Trading. This report is a visual representation of trade recommendations in the context of an account or group's models and available cash. You can use this report to see recommended trades, cash information, and important warnings for individual accounts or groups. You can also complete trade actions on this report.
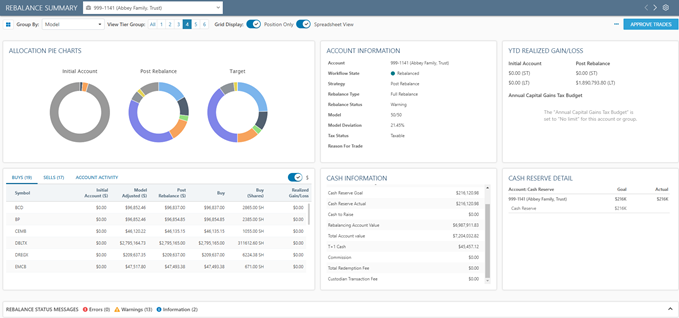
The Rebalance Summary is designed to offer a more user friendly way to view recommended trades and take actions on those trades with additional filters and features to help you view the report the way that works best for you.
To view similar information across all accounts, use the Trade Review page.
Locate the Rebalance Summary
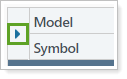
On the Rebalance page, select ![]() next to the account or group where you want to view the Rebalance Summary.
next to the account or group where you want to view the Rebalance Summary.
Navigate the Rebalance Summary
Use the following tools to customize your view of the Rebalance Summary:
Switch Between Accounts
When viewing a group or an account within a group, you can use this list at the top of the Rebalance Summary to switch between the group or accounts within the group.
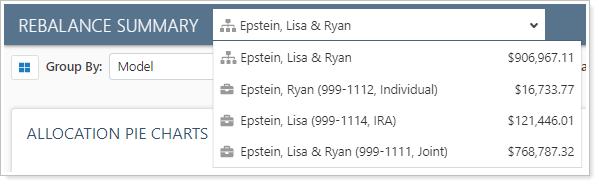
An icon lets you know if you're selecting an account (![]() ) or a group (
) or a group (![]() ).
).
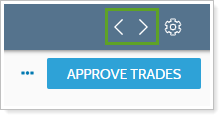
Go to the Next or Previous Rebalance Summary
When viewing a Rebalance Summary, the < and > icons at the top of the report let you navigate to the next or previous report as seen on the underlying Rebalance page. This lets you go through multiple reports without having to close one report to open another.
Set Defaults
Customize how all Rebalance Summary reports display data by setting default group, tier groups, and other view options. To set up defaults, click this icon in the top right of the report:
![]()
This opens Default Report Settings.
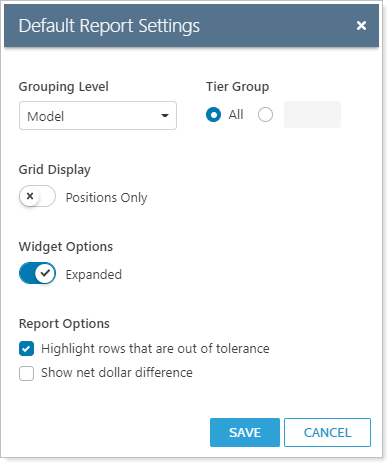
This gives you the following options where you can set default viewing and filtering options for every Rebalance Summary report you open:
- Group the report
- Select your tier group view
- Customize Your Positions and Subtier Models View
- Expand or collapse widgets
- Highlight Rows That are Out of Tolerance
- Show Net Dollar Difference
- Use order instructions
When you select Save, each Rebalance Summary you open will display the options you've saved.
Rebalance Status Messages
The Rebalance Status Messages section shows basic information, warnings, and errors associated with the rebalance. If your model deviation is off and you aren't producing expected trades, information in the Rebalance Status Messages section can tell you why.
When you open the report, you'll see a summary of the number of messages for the rebalance you're viewing:

Click ^ to expand messages and see errors, warnings, and messages.
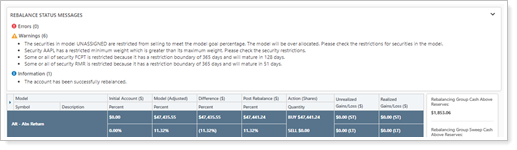
This section contains three types of messages:
-
Information Provides information about the results of the rebalance, as well as other account-specific details, like cash reserve notes and security restriction notes.
-
Warnings Informs you about a situation that may require action, such as warnings about securities with restrictions and messaging if a portfolio isn't able to trade to its min/max range. Warning messages will not prevent Tamarac Trading from rebalancing the account.
-
Error Informs you about a situation that requires action before the rebalance can continue, such as "The account has a negative total value. Please check the cash reserve amounts on the account." Error messages prevent Tamarac Trading from rebalancing the account.
Trading Alerts
If there's an account with a current trading note, you'll see a banner warning at the top of the Rebalance Summary with a link to download a bulk report that shows:
- Active trading alerts
- Pending order notes
- Restriction override notes
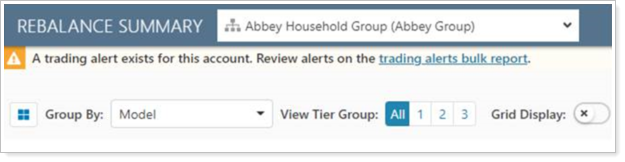
This banner gives you access to current trading notes without having to leave the report or view individual accounts.
Cash Information
The Rebalance Summary report shows cash information at the top of the report using the following widgets:
Account Information Widget
The Account Information widget gives you an at-a-glance view of valuable cash information you'll need to consider like rebalance status, model deviation, account value, T+1 cash, fees, and commissions.
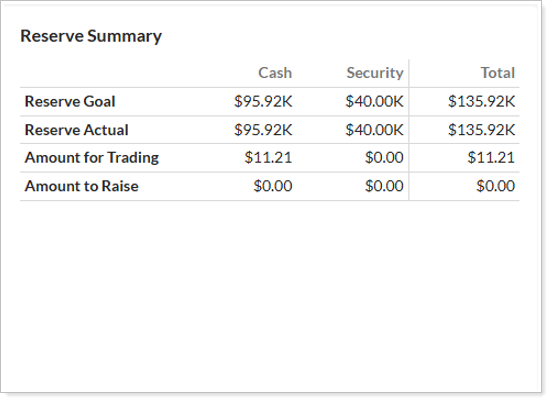
Reserve Summary Widget
The Reserve Summary widget shows an at-a-glance view of valuable cash information you'll need to consider such as reserve goals, cash available to trade, and the cash amount to raise.
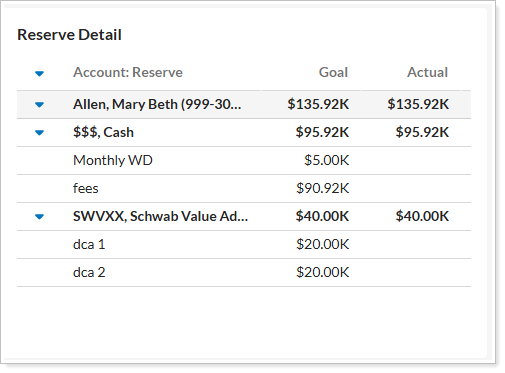
Reserve DETAIL Widget
The Reserve Detail widget gives you insights into the reserves set for the account you're viewing. Cash reserves are displayed as $$$. Security reserves appear with their security symbol.
The reserves information section in the Spreadsheet View of the Rebalance Summary gives you the status of your cash reserves.
For more information about account reserves and cash management, see Learn More About Cash Management.
For more information about Rebalance Summary widgets, see Widgets on the Rebalance Summary.
Reporting Section
The trades information on the Rebalance Summary shows you recommended trades, informational messages about securities, values, and allocations, all grouped contextually for the account or gorup you're viewing. You can group the report by model or security category and change the tier group you're viewing.
In addition, the following features are available to help you review and understand the recommended trades:
Expand and Collapse Rows
Expand or collapse all rows on the report using the ![]() icon on the top of the reporting section.
icon on the top of the reporting section.
Tier Summaries
Summary rows appear at the top of each grouping and provide values for the positions underneath. The summary row allows you to review the report at a glance without the need to scroll to the bottom of the tier group and stays as you scroll through the group until you reach the next grouping.
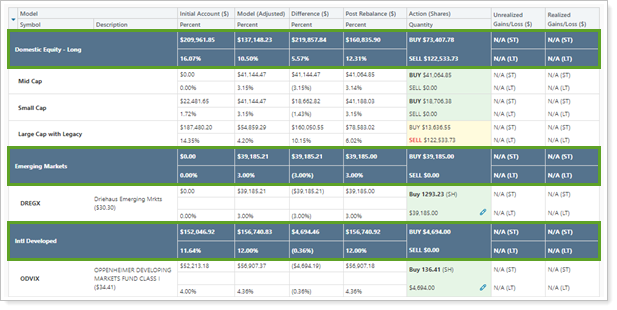
Columns and Calculations
The following is a summary of the information and calculations used on the Rebalance Summary:
| Column | More Information |
|---|---|
| Description | Displays the long name for the security. Description also shows the price used to generate the rebalance strategy in parentheses after the description. If the price is a custom price, it is marked with an asterisk (*). |
| Initial Account ($) | Shows the initial dollar value and percent of account for the row listed. If expanded, this column can show values at the individual security level. If collapsed, this column can show values at the model level. |
| Model (Adjusted) | Shows adjusted model allocation based off the current holdings in the account if using rank-based models. |
| Difference ($) | Shows the dollar amount of how underweight or overweight the security or model is to the adjusted model goal. This is calculated as Initial Account ($) – Model (adjusted). |
| Post Rebalance ($) | Shows the dollar amount held in a security or model after the rebalance/custom strategy. This is calculated as Initial Account ($) + Buy ($) for a buy or Initial Account ($) – Sell ($) for a sell. |
| Buy ($)/ Sell ($) | Shows the proposed dollar amount of the buy or sell. |
| Action (Shares) | When expanded, shows the recommended trade in dollars or number of shares, if any, and also allows you to edit the trade, place it on hold, or add an order note. |
| Unrealized Gain/Loss ($) | Shows any resulting unrealized gains or losses from the trades. If the account is tax-exempt, this column will show N/A for that trade. |
| Realized Gain/Loss ($) |
Shows any resulting realized gains or losses from the trades. If the account is not in a rebalanced state, this column will show $0. If the account is tax-exempt, this column will show N/A for that trade. |
| Comment | When expanded, this row shows the reasoning behind the results of the rebalance for that security, as well as any restrictions or comments about that security. |
| UNASSIGNED | Unassigned securities, those securities not assigned to any client models, appear at the end of the Rebalance Summary under the heading UNASSIGNED. Allocations in these securities won't contribute to the Rebalancing Account Value amount. For more information, see Legacy Positions. |
Trading and Account Actions on the Rebalance Summary
In addition to seeing recommended trades and cash information for the account or group, the Rebalance Summary also allows you to take the following actions:
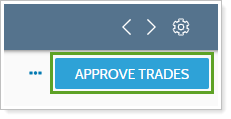
Approve Trades
Select Approve Trades for the individual account or rebalancing group. If an account is in a rebalancing group, you must approve trades for the group as a whole.
For more information, see Approve Trades.
If required, you can also approve non-discretionary trades on the Rebalance Summary report.
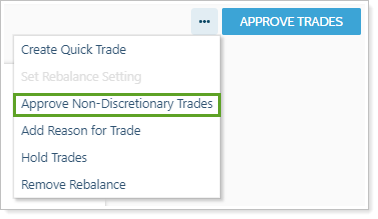
For more information, see Discretionary Account Setting.
Add, Edit, and Delete Notes
There are different kinds of notes, but each allows you to add documentation to individual accounts or groups. This allows you to document information about trades, orders, client wishes, or other information you will need to see in the future.
To add account-level notes, use the Account Notes, Trade Reason, and Allocation Charts Widget:
-
In the Account Notes tab, select Add note to add an account or trading note.
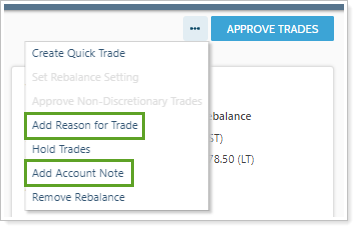
-
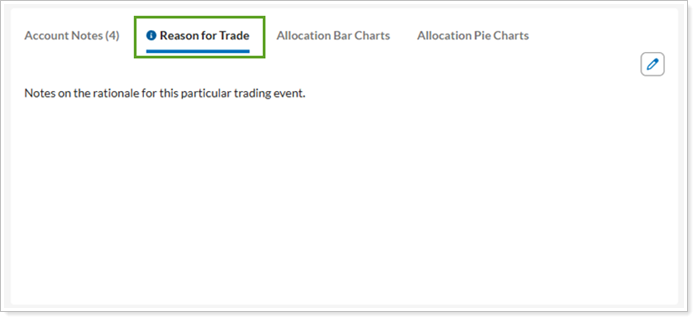
Select the Reason for Trade tab to add trade rationale for this rebalance event to the account or group you're viewing.
To add notes to individual trades, use the
 icon to add an order note to the trade.
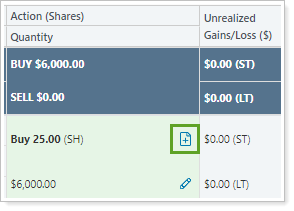
For steps to add, edit, and delete notes in Tamarac Trading, see Add, Edit, and Delete Notes.
Edit Trades/Create a Custom Strategy
After a rebalance, the Rebalance Summary lists the ideal recommended trades for the account or group. However, there are cases where you'll want to change the recommended trades.
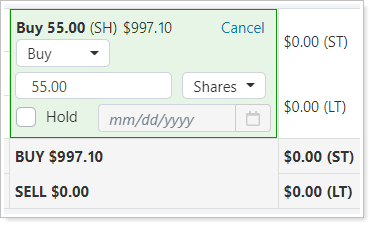
On the Rebalance Summary, you can edit details about a trade:
-
Change the amount of the trade in Dollars, Shares, or % of Account Value.
-
Change the trade action to None to remove the recommended buy or sell.
-
Select specific tax lots to sell.
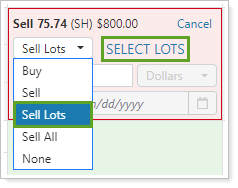
For more information, see Manual Trades.
Create a Quick Trade
You can add a trade that isn't recommended on the Rebalance Summary using Create Quick Trade.
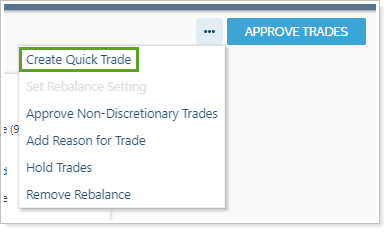
You can then add details about the security and the trade you'd like to add.
For more information, see Create a Quick Trade.
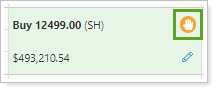
Hold Trades
You can select individual trades and place them on hold for future execution.
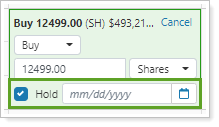
You'll see an icon designating the trade is on hold.
You can also place all trades on hold in the account using Hold Trades.
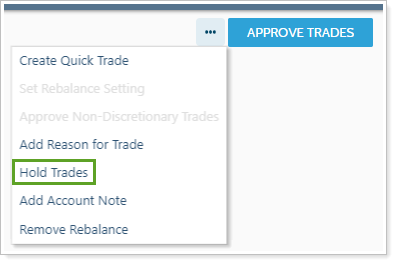
For information about trade holds including best practices, see Trades on Hold.
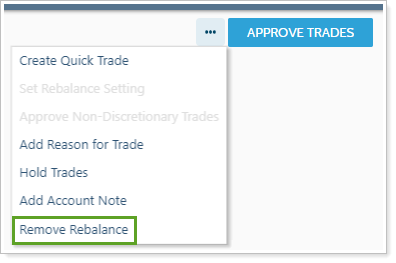
Remove Rebalance
The Remove Rebalance option allows you to remove all recommended trades from the account or group.
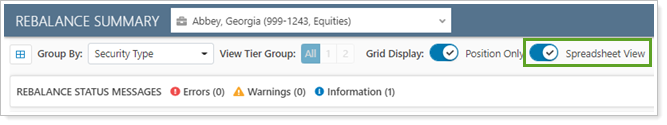
Open Spreadsheet view
With Spreadsheet view, you can do the following:
- Review and edit at the trade level
- Review high-level, holistic initial and post-rebalance data
- Evaluate individual trades
- Select individual lots to trade
- And more...
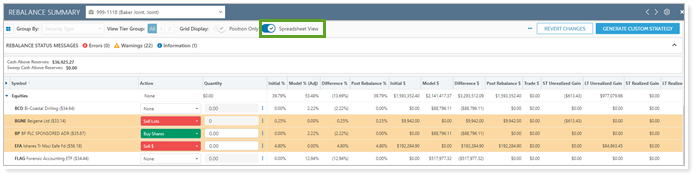
To toggle between the standard view and spreadsheet view, select Spreadsheet view at the top of the Rebalance Summary:
For more about reviewing, adjusting, and approving trades in Spreadsheet view, see Spreadsheet view.
Customize the Rebalance Summary
Use the following tools to customize your view of the Rebalance Summary:
Expand or collapse widgets
The widgets at the top of the report show an at-a-glance view of information about the account or group and the recommended trades on the report. These widgets show basic information about allocations, cash information, and more. For a full description of these widgets and the information they show, see Widgets on the Rebalance Summary.
You can customize the Rebalance Summary to either expand or collapse all widgets.
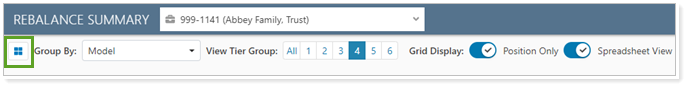
Select  to hide the widgets. Select
  to expand the widgets.
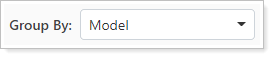
Group the report
In the Grouping Level list, choose how you want to group the report. You can group by model, security type, and other security categories. This allows you to view trades in different contexts depending on how you want to complete trading activity.
Select your tier group view
Tier Group lets you expand or contract your view of the Rebalance Summary by model tiers.
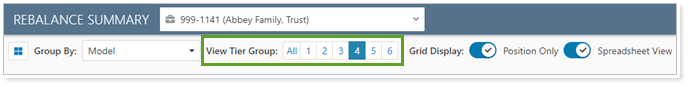
Each number corresponds to a tier in the model assigned to the account or group.
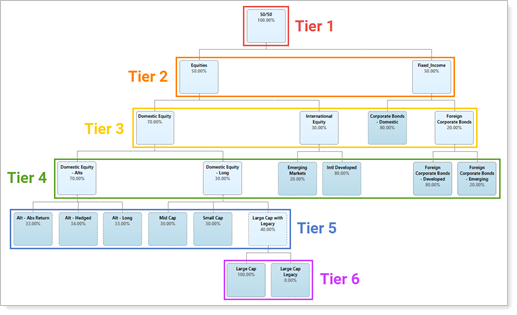
All lets you see every position in every tier of the assigned model. When you choose a tier group, you'll see the trades in the Security Level models at that tier group and above. As an example, if you choose 2, you'll see recommended trades for Security Level models at the second and first tier of the assigned model. If you choose 5, you'll see recommended trades for Security Level models at tiers 5, 4, 3, 2, and 1. This allows you to view the report on a more granular level and reduces noise to help you make smart decisions.
Customize Your Positions and Subtier Models View
In addition, you can toggle Grid Display to change your view of the positions you see at the tier group. When Positions Only is enabled, you'll see only the individual positions in that tier:

When Positions Only is disabled, you'll see positions and subtier models together:

Highlight Rows That are Out of Tolerance
In Default Report Settings, this option indicates rows where securities are out of tolerance with respect to the models in which they belong.
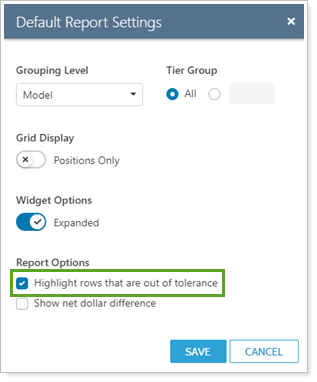
Select to indicate rows where securities are out of tolerance with respect to the models in which they belong.
Select the Highlight rows that are out of tolerance option to visually find securities out of tolerance and save this as your default view by clicking Save Settings as Default.
Show Net Dollar Difference
In Default Report Settings, this option alters how the Difference ($) column is calculated.
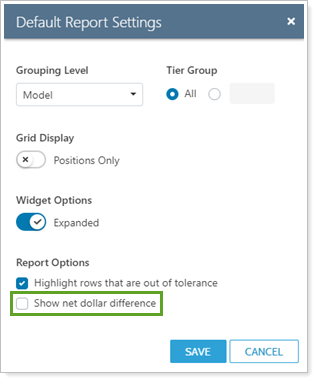
- When this is cleared, the Difference ($) column will show the absolute sum of all values.
- When this is checked, the Difference ($) column will show the relative sum; this takes negative values into account.
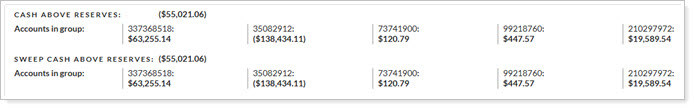
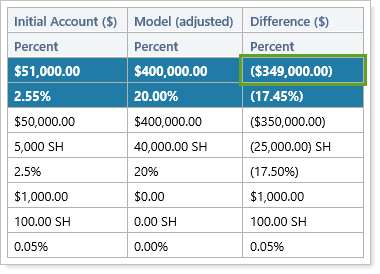
Net Dollar Difference Example
A client's rebalance summary shows the following when viewing in absolute dollars, the default setting. In this case, the amount shown is the absolute sum of the two Difference column amounts, regardless of negative or positive value: $350,000 + $1,000 = $351,000.
![]()
By checking the Show net dollar differences check box, the Rebalance Summary shows a calculation of the net dollar difference and considers the negative amount: ($350,000) + $1,000 = ($349,000).
Use order instructions
In Default Report Settings, select Order Instructions to show or hide columns by default on the page for those who use FIX Flyer to generate trades.

You options are:
- Turned on. Expanded is enabled and the Rebalance Summary displays the columns.
- Turned off. Expanded is disabled and the Rebalance Summary does not display the columns.

For more information about order instructions, see Show or Hide Order Instructions on the Rebalance Summary Report.
Rebalance Summary as a PDF Report
Rebalance Summary data can be used to generate PDF reports. These reports can help you share trade information with clients, or can be used for internal review of trades.
There are two report section types available as a PDF:
Rebalance Summary Charts
This section shows side-by-side pie charts with a configurable legend. This allows you to compare rebalance information visually.
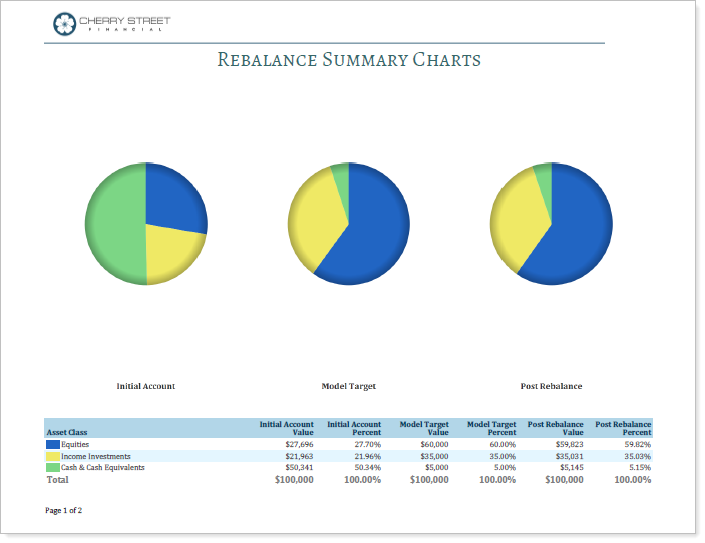
For more information on this PDF report section, see Rebalance Summary Charts Report.
Rebalance Summary Details
This section shows rebalance details in a table that you can configure to include shares, model percentages, dollar differences, short term gains and losses, cash information, and more.
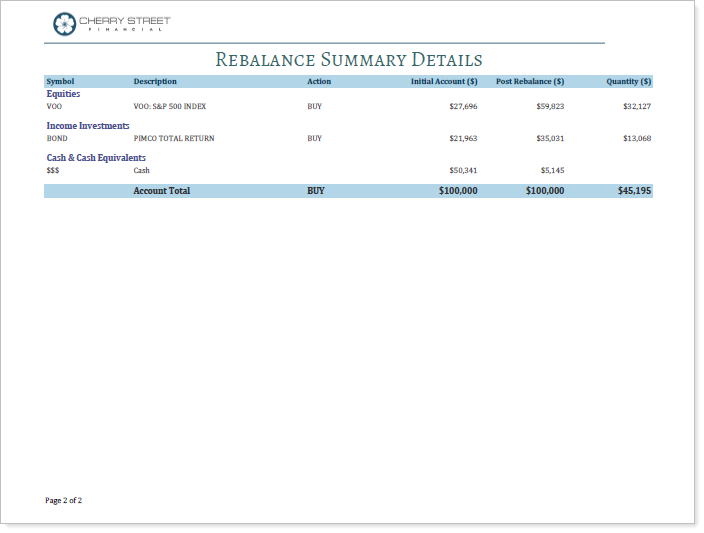
For more information on this PDF report section, see Rebalance Summary Details Report.