
Contents
|
Why Use the Rebalance Summary Details Report? |
Introduction
| Applies to: | ||
|---|---|---|
| Dynamic | Client Portal | |
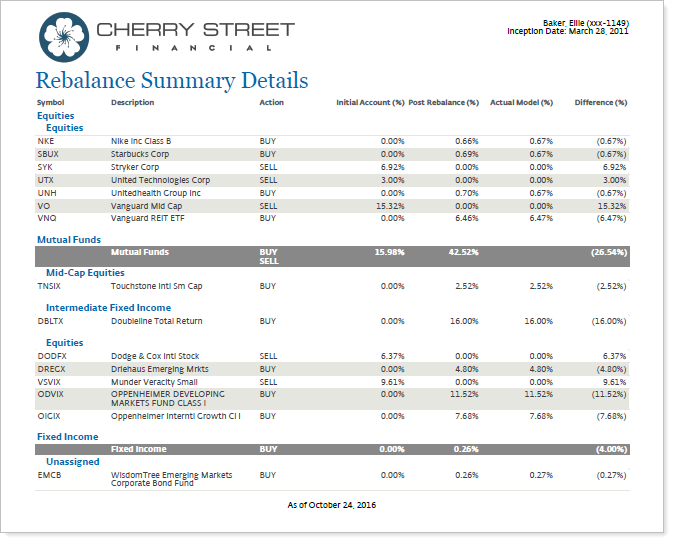
Use the Rebalance Summary Details report to see specific data points for recommended trades at the individual account level, the group level, or both. This allows you to review selected information about proposed trades or share this information with clients through a PDF report.
In this report, you can show information about:
-
Trades.See number of shares that will be traded in terms of dollars or percentage.
-
Rebalance Details.Compare pre- and post-rebalance data such as showing differences in dollars and shares, realized and unrealized gains and losses, transaction fees, commissions, and more.
Use the Rebalance Summary Charts PDF report section alongside this report to visually represent proposed trades.
Why Use the Rebalance Summary Details Report?
This report lets you present data that answer these questions:
-
What are the percentage, dollar amounts, and/or shares of a portfolio before and after these trades are executed?
-
How will trades appear when grouped by category?
-
What would the proposed trades look like in an individual account? How would it look for the entire rebalancing group?
Features in the Rebalance Summary Details Report
You can display data on this report the following ways:
-
Grouping and sorting.Choose up to three levels of category grouping, then choose the sorting for each of those grouping levels.
-
Unmanaged asset control.Include, exclude, or separate unmanaged assets.
-
Customize columns.Choose columns to show various data points about holdings and recommended trades.
-
Report as a group or as single accounts.Report as a group, single account, or both and include underlying data for a group, if desired.
Settings in the Report
When creating a PDF template that contains the Rebalance Summary Details report, you can use these settings to customize how the report appears:
Basic Information
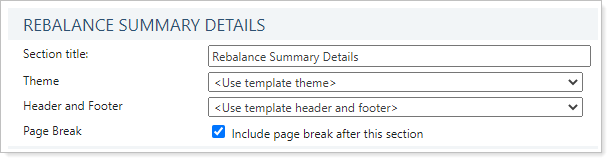
- Section Title. Designate what the section will be called in the PDF report.
- Theme. Designate what theme the section will use or use defaults.
- Header and Footer. Choose a unique header and footer for the section or use defaults.
- Include Page Break After This Section. Control where page breaks occur in the PDF report.
Display Settings
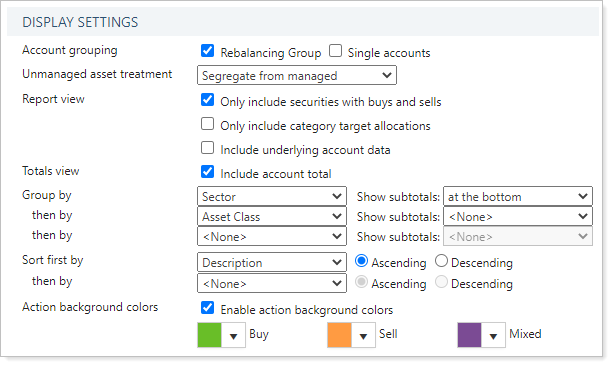
- Account Grouping. Controls how reports are created for the PDF section, whether at the group level, single account level, or both.
- Unmanaged Asset Treatment. Show or hide unmanaged assets on the report.
- Only Include Securities With Buys and Sells. Show recommended buys and sells or all holdings on the report.
- Only Include Category Target Allocations. Show granular target allocation values on the report.
- Include Underlying Account Data. Show allocations and recommended trades for individual accounts within a group or not.
- Include Account Total. Show or hide a grand total row on the report.
- Group By/Then By. Organize the report by security level model or various security categories, including asset class and security type.
- Show Subtotals. Add subtotals to each category grouping or leave those off the report.
- Sort First By/Then By. Determine how data in separate category groupings will be sorted.
- Enable Action Background Colors. Add color coding to the actions (buys and sells) on the report.
Data Options
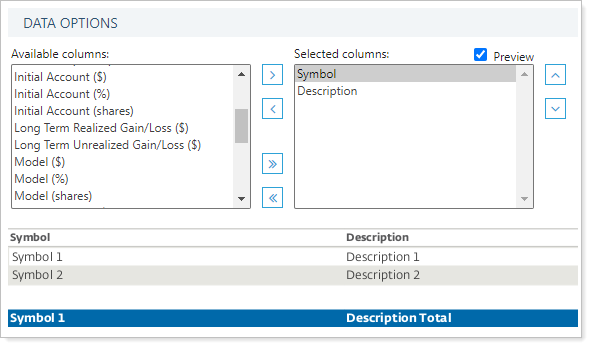
- Available/Selected Columns. Include and arrange columns of data points in the desired order.
- Preview. Select to see a sample of what rows and columns will look like with the selected settings.
Use This Report
After customizing your PDF template, here are ways you can take further action to generate, edit, and delete reports, as well as share them with clients:
To learn more about reports in Tamarac, see Introduction to Reports.To learn more about how to generate a report, change the data displayed, print or export the report data, and more, see Basics of Working With Reports.To learn more about creating and using PDF reports, see Understanding PDF Reports and Workflow: Generate a PDF Report.