 Back
Back|
Back |
|
Interval Performance Report
| Applies to: | |||
|---|---|---|---|
| ✔ Dynamic | Mobile | Client Portal | |
The Interval Performance report is useful for troubleshooting spikes and dips in performance. This report is intended for advisor use only.
To request the Interval Performance report, please contact your dedicated support team.
For more information on how Tamarac handles performance calculations, see Performance Calculations and Learn More About Calculations.
In the Interval Performance report, daily returns are linked to calculate time-weighted return. It can be narrowed down to show only:
Specific Categories or Securities.Evaluate the performance of a specific category, such as Asset Class, or evaluate performance on a security-by-security basis.
Returns Outside a Certain Threshold.You set the net return threshold to find returns that are within a certain threshold. For example, you can use this to find returns exceeding a set percentage if you're looking for a specific anomalous return.
Days With Flows.Limit the report to only days with flows to reduce the total number of data points and make it easier to find what you're looking for, or find performance spikes on days with no flows by including all the days in the period.
A client calls you and is curious about why the performance on his quarterly report doesn't match his expectations. You quickly generate an Interval Performance report for that client's group, setting the date period to the quarter in question. This allows you to see all the performance information in one place.
Armed with this information, you can then determine whether the gross return is closer to what the client was expecting, or perhaps the IRR is closer. You then remind the client about the potential impact on performance of management fees or the timing of flows, explaining the difference between the expected performance and the actual reported performance.
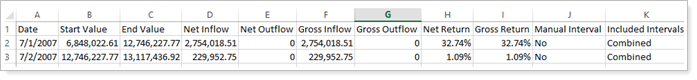
Advisor Kelly is used to diving into performance calculations using his own tools. Kelly seeks to deeply understand where performance numbers are coming from. In this case, the advisor generates an Interval Performance report for the desired categories and date range, and exports it to Excel. Kelly then uses his own Excel formulas to do his custom performance analysis.
The dynamic report helps you easily filter and sort data to drill down to meaningful results. Interactive reporting features include the following.
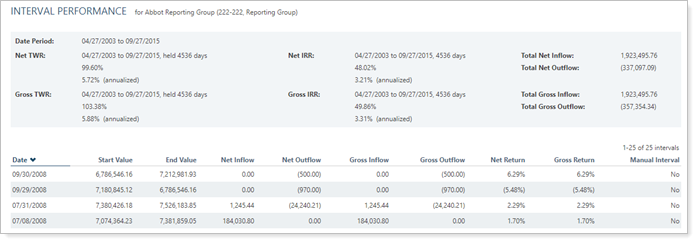
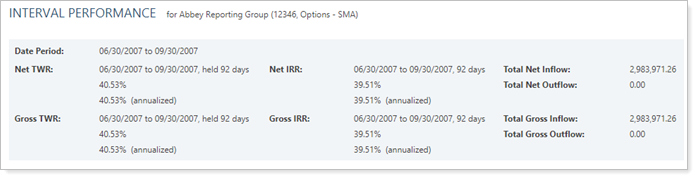
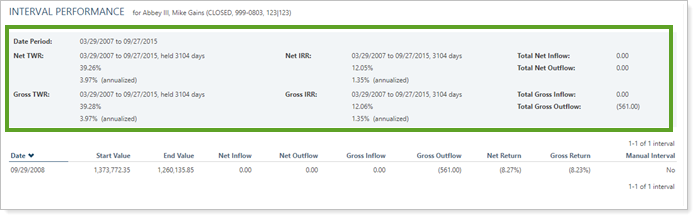
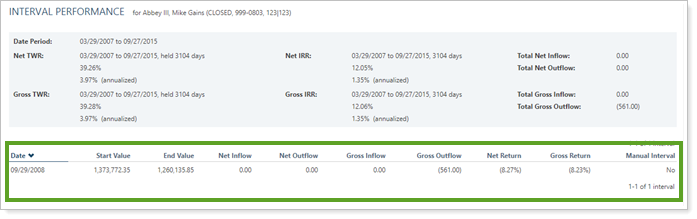
At the beginning of the report, performance details for the specified interval are displayed. This is the best place to see all performance data—for net and gross TWR and IRR, plus flows—all in one place.
Drill down into details of the specific performance behavior with the listing of all applicable data points. You can choose whether or not to see dates that have no flows.
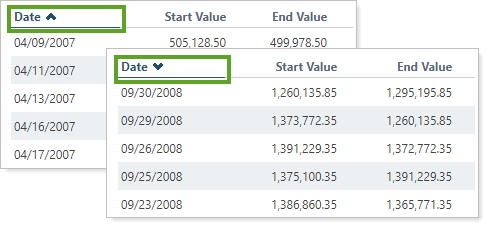
Click the column header to change sort order. The caret direction indicates ascending or descending sorting.
Display managed, unmanaged, and total details side by side.
For more information about marking securities as unmanaged and how reports display unmanaged assets, see:
There is no Interval Performance dashboard widget available for the reporting dashboard.
The following settings are available for the Interval Performance report.
| Setting | Details | Available In... |
|---|---|---|
| Dynamic Report | ||
| Report Name | Designate a unique name for the view of the report view. | X |
| Mark as Publicly Accessible | Share the report view. | X |
| Show Intervals For |
Include managed, unmanaged, or both asset types. |
X |
| Filter With Category Type Lists | See performance intervals for one or more specific categories. | X |
|
Designate which securities to include or exclude. Securities added will be cleared if you choose to Show Intervals For one of the other list options and save the change. |
X | |
| Date Period | Select the date period you want to use for the report. | X |
| Net Return Threshold | Display returns above or below a certain percent threshold. | X |
| Include Days With No Flows | Show all the days in the period, regardless of flows. | X |
To learn more about reports in Tamarac, see Introduction to Reports.
To learn more about how to generate a report, change the data displayed, print or export the report data, and more, see Basics of Working With Reports.
To learn more about creating and using PDF reports, see Understanding PDF Reports and Workflow: Generate a PDF Report.