
Contents
Introduction
You can include wide array of the most popular reports from Tamarac Reporting on the new client portal. Most of them offer the same features and functionality you're used to enhanced with a clean, modern look and feel for clients.
On this page, you'll find a complete list of all the Tamarac Reporting reports you can include as pages or dashboard widgets in the new client portal.
For steps to add report pages to a client portal, see Customize New Client Portal Pages and Reports.
Performance Pages
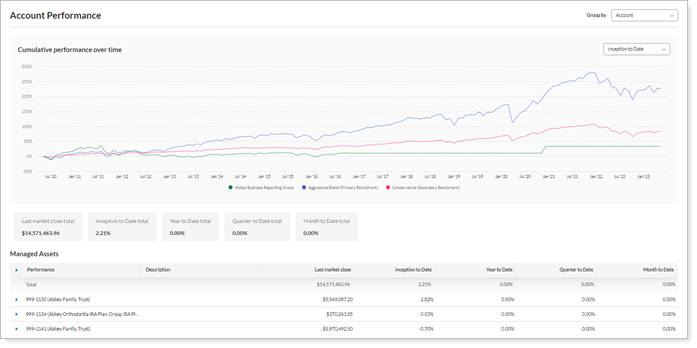
Account Performance
-
When to useThe Account Performance page presents account values. The page includes a line graph for one performance period and a table of returns for selected dates. You ca add target benchmarks in both the basic and chart views. You can drill down on the performance for each account to view either underlying holdings or underlying accounts.
-
AvailabilityDesktop page, desktop widget, mobile report, mobile widget
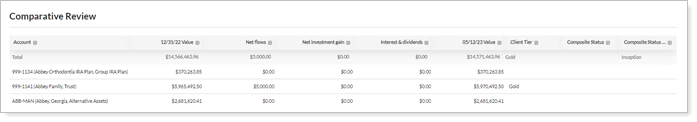
Comparative Review
-
When to useThe Comparative Review page shows consolidated totals for your accounts for a particular date range in both IRR and TWR. This page can also show you how the value of your accounts is distributed among your asset classes.
-
AvailabilityDesktop page, desktop widget, mobile report, mobile widget
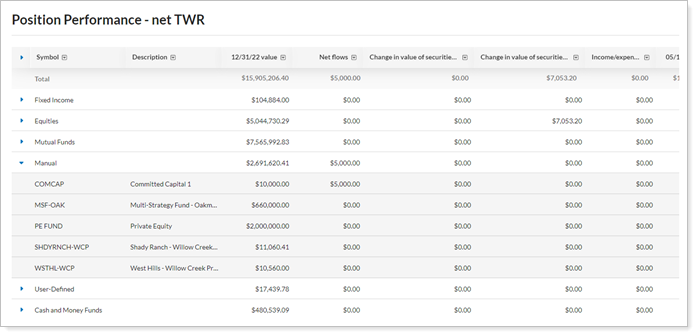
Position Performance
-
When to useThe Position Performance page section displays the performance of the portfolio's individual positions based on selected metrics and groupings.
-
AvailabilityDesktop page, desktop widget, mobile report, mobile widget
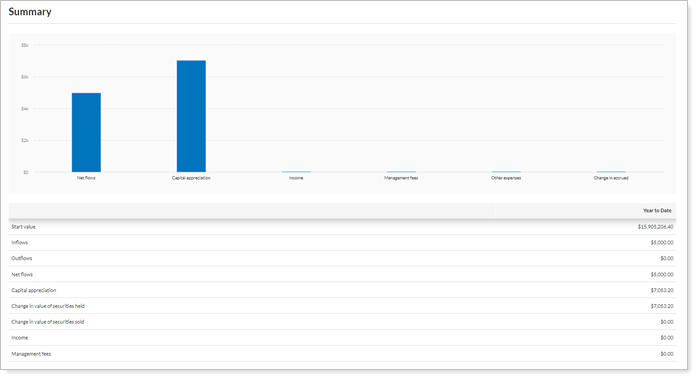
Summary
-
When to useThe Summary page provides a chart view for up to five time periods and table of data that compares the portfolio performance to selected indexes.
-
AvailabilityDesktop page, desktop widget, mobile widget
Holdings Pages
Asset Allocation
-
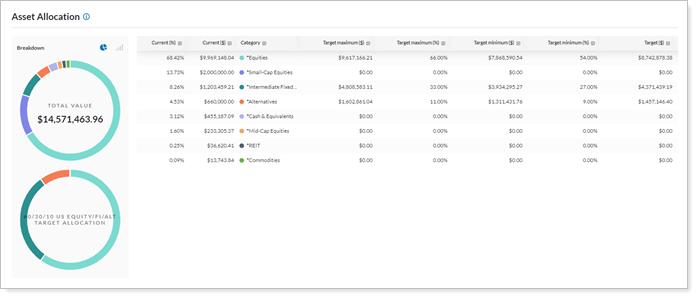
When to useThe Asset Allocation page presents a pie chart or bar chart view of an account's assets with a table that displays the actual percentages for each group. The chart is interactive. You can choose from two different grouping levels for the display.
-
AvailabilityDesktop page, desktop widget, mobile report, mobile widget
Committed Capital
-
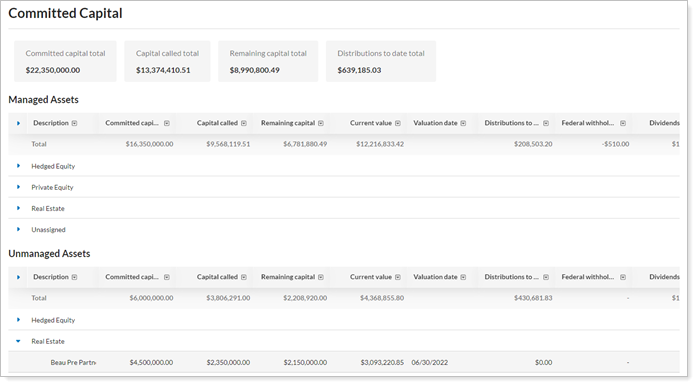
When to useIf a client has committed capital to a venture capital fund, they will generally need to make contributions over three to five years to satisfy the terms of the agreement. You can rack the payment information on the Committed Capital page.
-
AvailabilityDesktop page, desktop widget, mobile report
Holdings
-
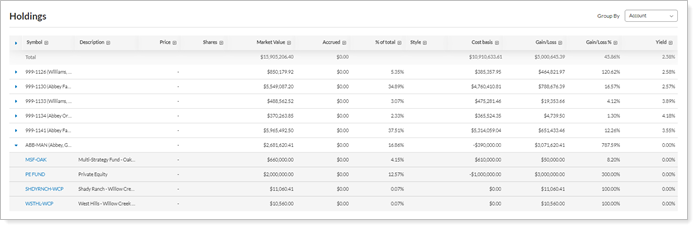
When to useThe Holdings page displays all the holdings in an account. You can choose which columns to display and their order in the page.
-
AvailabilityDesktop page, desktop widget, mobile report, mobile widget
Transaction Pages
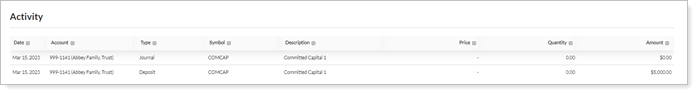
Activity (called Transactions in Reporting)
-
When to useThe Activity page displays the transactions for an account or group over a specified period.
-
AvailabilityDesktop page, desktop widget, mobile report, mobile widget
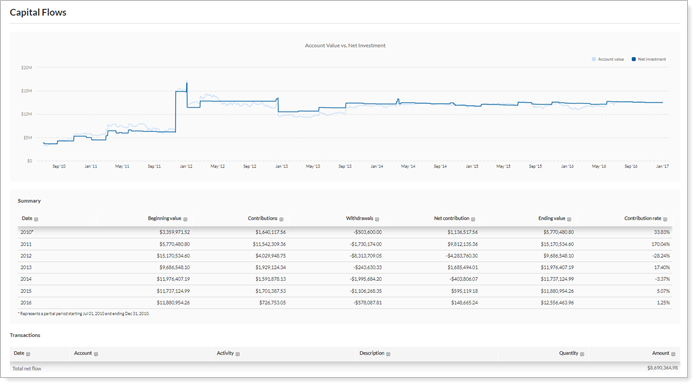
Capital Flows
-
When to useThe Capital Flows page displays all capital flow transactions over a specified time period for the account. You have the option to filter these flows by either a dollar range or percentage of the account value. You can also choose to show an Account Value vs. Net Investment chart for a specified time period.
-
AvailabilityDesktop page, desktop widget, mobile report, mobile widget
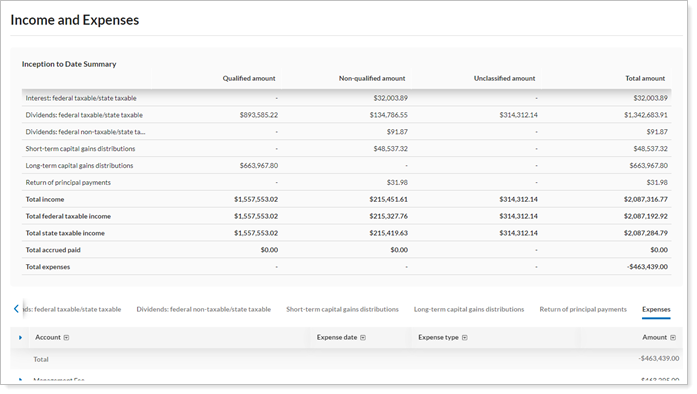
Income & Expenses
-
When to useThe Income and Expenses page provides a consolidated view of income and expenses for your client's accounts and groups.
-
AvailabilityDesktop page, desktop widget
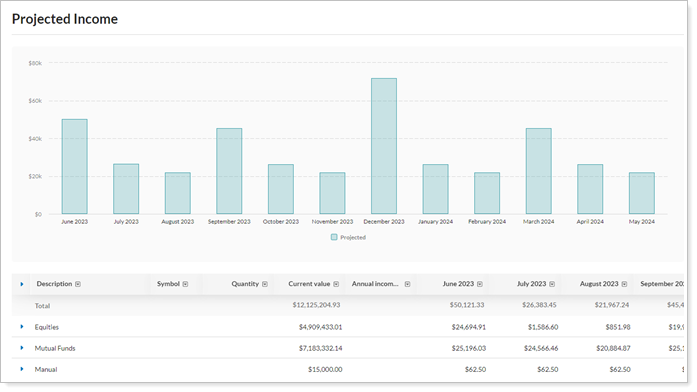
Projected Income
-
When to useProjected Income page provides data on expected income from dividends, principal repayments, and coupons.
-
AvailabilityDesktop page, desktop widget, mobile report, mobile widget
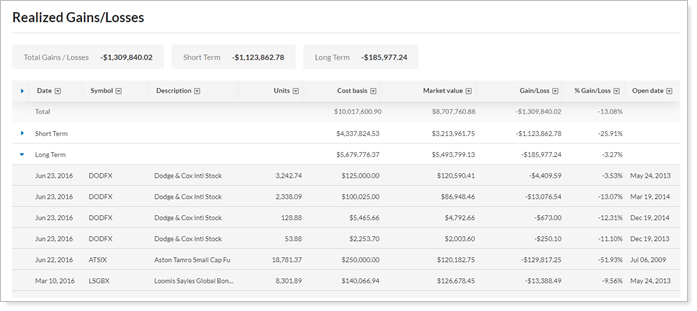
Realized Gains & Losses
-
When to useThe Realized Gains and Losses page is a transaction page that shows all realized gain/loss transactions in the account over a specified period.
-
AvailabilityDesktop page, desktop widget, mobile report, mobile widget