
Contents
Reporting
 New Report: Summary by Category Report
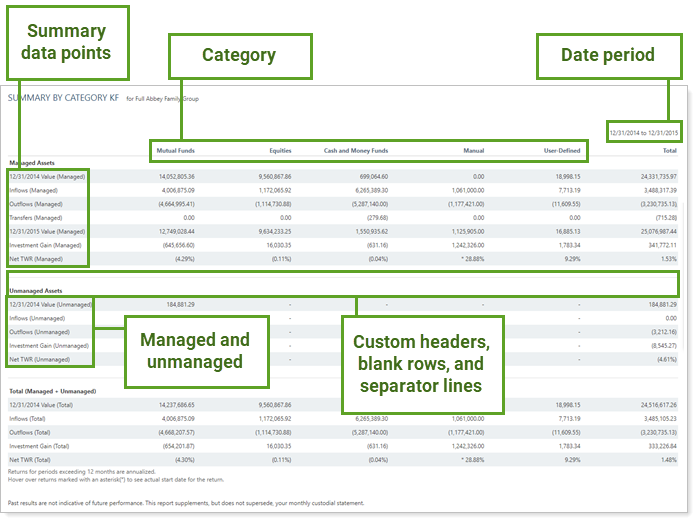
We are excited to introduce our newest performance report: the Summary by Category report. This new report aggregates performance, holdings, and transactions data to provide details about how an account or group achieved the reported returns at the category level.
The report helps you answer questions such as:
- How did an account's holdings change during this period?
- How did managed assets perform, compared to unmanaged assets?
- Can I show clients more detail than the Summary Report shows?
When you use the Summary by Category report, the following features will help you get to your data efficiently:
-
Category-level reporting. See performance, transaction, and holdings results at the category level, with available column ordering. Uncategorized holdings are aggregated into the Unassigned column, which is included automatically. This column always appears on the right, after the individual category columns and before the Total column, regardless of Order by configuration.
This report respects account-level category overrides. For more information about category overrides, see Maintaining Accounts: The Category Overrides Page.
-
One date period. Unlike the Summary report, the Summary by Category report only applies to one date period.
-
Customizable columns.In addition to category results, the report displays securities that aren't assigned to a category aggregated in the Unassigned column. You can also add a Total column, or use Always include selected categories regardless of value to manually include columns for categories, even if a particular account doesn't hold that category.
-
Flexible data points.Select rows to display a side-by-side comparison for the date period. Available rows include flows, returns, start and end values, capital appreciation, income and expenses, gains and losses, category and account benchmark, and more.
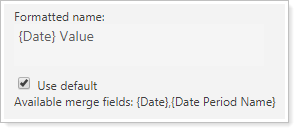
Customize the name of the Start Value and End Value data points on the dynamic and PDF versions of the report using merge fields to insert {Date} or {Date Period Name}. For more information on how to customize data point names, see Customize the Name of Column Headings for Reports.
-
Customize the Look. Use sub-headings, dividers, and blank white rows to create separate sections and draw attention to the most important data points, such as net investment gain or return numbers. You can change the name of many rows. For more information, see Available/Selected Rows.
-
Show managed and unmanaged assets. Display managed, unmanaged, and total asset summary statistics side by side.
This report is available as a dynamic report, a PDF report template, or on the client portal as a client view report. You can also export the dynamic report to CSV.
Position Performance Report Improvements
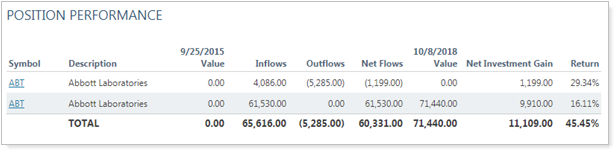
The Position Performance report is often used in conjunction with other performance reports to see the impact of individual securities within the larger context of overall portfolio performance. But until now, it's not always been easy to correlate the results from the Position Performance report with trends in other reports. We've standardized and expanded data fields to help resolve this issue.
Dynamic report changes include the following:
-
Separate Line Items For Each Holding Period. To make comparing holding periods between reports easier, we've split each holding period into a separate line item on the dynamic Position Performance report, just like on the PDF version of the report.
-
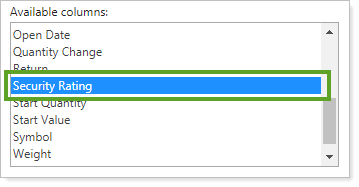
Security custom fields. We know how useful security custom fields are for displaying descriptive features of securities such as rating, market cap, or liquidity. That's why we've made them available on the dynamic Position Performance report. You'll find security custom fields among the available data points in the available/selected list.
-
New Dynamic Report Settings. The following report settings that were previously available only on the PDF report are now also available on the dynamic Position Performance report, allowing you to toggle them on and off as desired:
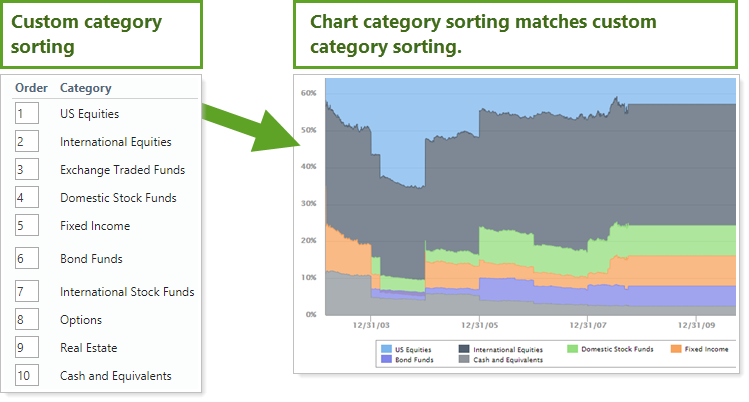
Control Asset Allocation Over Time Category Sorting
In Tamarac Reporting, you can set the order in which reports display security categories. For example, when you sort by asset class on the Holdings report, the report displays asset classes held in that account or group in the order you set. This allows you to organize categories on reports according to firm standards and create a consistent and cohesive reporting package.
In a previous release, we adjusted this feature on the asset allocation over time chart. We heard your comments about this change, and we've put the category sorting back the way it was for the asset allocation over time chart. Now you can control the category order on both the dynamic and PDF versions of the Asset Allocation report by setting the category sort order, bringing that important firm-wide consistency to another part of your reporting package.
Expanded Pie Chart Features
We know you like having the option to set your Asset Allocation pie charts to display a gradient or a donut chart. That's why we've expanded these features to the Bond Analysis report pie chart. Now you can create Bond Analysis pie charts that have the same formatting as Asset Allocation pie charts, enhancing your PDF reports with consistent branding across all pages.
Remember you can configure colors for all charts in the site theme.
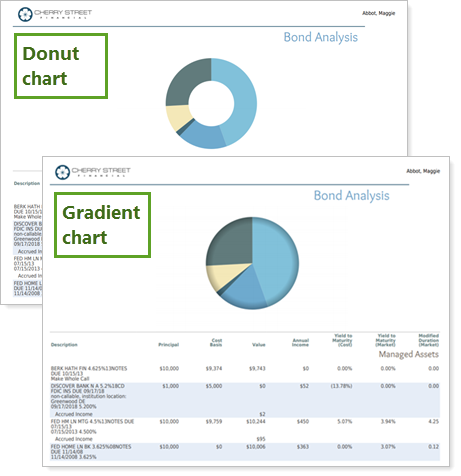
New settings available on the Bond Analysis report are:
Standardized Data Labeling
We've made data labels more consistent on reports across the board. While your results will remain the same, you'll find it easier to compare data across reports with these standard naming conventions. These changes include:
-
Renamed columns. We've renamed some of the existing columns in the available/selected list. The renamed columns are:
Old Name New Name Net Contributions Net Flows Additions/Purchases Inflows Contributions Inflows Withdrawals/Sales Outflows Withdrawals Outflows Reports currently using one of these columns will continue to display the existing column name. For example, if you include Net Contributions now, after the release your report column will still say Net Contributions, but it will report net flows.
-
Standardized meanings for Missing Return indicators. On reports, you may have noticed that some cells were marked with n/a, -, or left blank. Now, when you see those missing return indicators in a report row, they always mean the following:
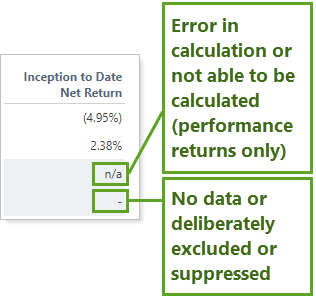
Display What it means n/a -
Invalid return: The return was not calculated. For example, if a performance report is run for the year to date, but an account was closed two years before, that account's data will be marked n/a for performance returns.
This applies only to performance returns.
- -
There are no data to display, or no data are available. For example, if a holdings or transaction report is run for the year to date, but an account was closed two years before, that account's values will be marked -.
-
The value cannot be calculated. For example, if the data point is calculated by dividing and the denominator is 0, Tamarac returns -.
-
If you choose to exclude an account from performance, you'll see - on performance reports for that account.
This takes precedence over n/a.
0 -
The value is actually zero.
On some reports, such as the Account Performance report, you may also notice some rows aren't displayed. This occurs when all data for the row are n/a, -, or there are no data.
You may also see a row dropped if it doesn't have any child rows. For example, if you're displaying rows by account and one account doesn't have data for the date periods selected, that account would not be displayed.
-
Usability
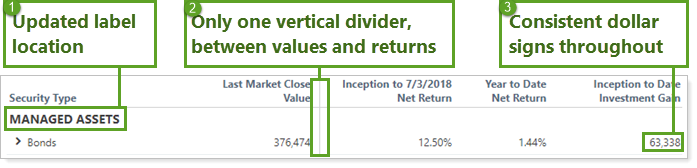
Minor Adjustments to the Account Performance Report Look
We've updated the Account Performance report to make it easier to find and interpret account and group performance results. These changes include:
-
When you report managed and unmanaged assets separately, the Managed Assets and Unmanaged Assets labels and associated accounts and benchmarks have been moved to group related data together.
-
Now there's just one vertical dividing line between values and returns, making it easier to differentiate account value data from return data.
-
To maintain consistency, when you choose to report net investment gains, dollar values no longer display dollar signs.
You'll also notice the following additional enhancements:
-
We've renamed the setting where you choose to show net investment gain or returns, and on reports you'll notice the column names have been updated to match. This change makes it easier to know what the setting does and matches naming conventions in other reports.
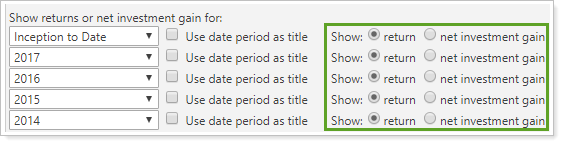
Important
When you select Show: net investment gain, the report always displays net investment gain, regardless of other settings. For more information, see Show Return or Net Investment Gain.
-
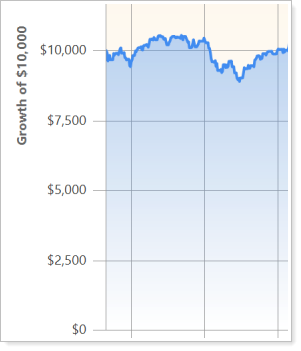
On the PDF report, you'll notice the line chart gradient now matches the dynamic report. Use the site theme to control the gradient.
-
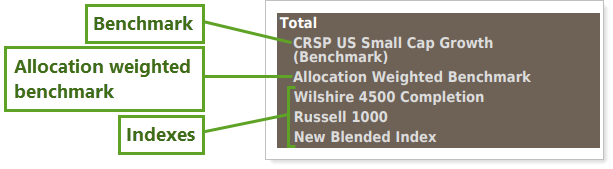
Benchmarks, allocation weighted benchmarks, and indexes are now listed in a consistent order with clearer formatting at the end of the table.
-
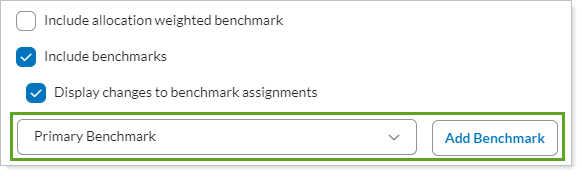
On the PDF report, when you selected Include benchmarks, Benchmark 1 was displayed for separately managed accounts (SMAs). Now you select Include benchmarks and then designate specifically which benchmark(s) you want displayed for SMAs using the Selected Benchmarks list.
Integrations
Access Pershing Documents Through the Tamarac Document Vault
Your client portal provides a huge benefit to your clients by bringing together information from many sources. The portal can serve as the client's one-stop source for reviewing financial accounts, financial plan results, and even assets and liabilities, as well as providing a secure method for exchanging files.
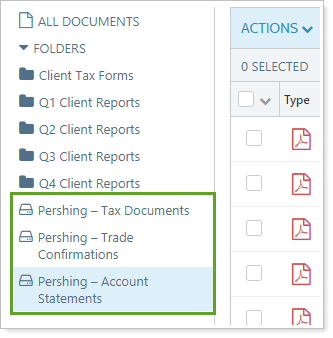
With this release, firms that custody with Pershing can take this convenience one step further by giving clients direct access to their Pershing files, right within the Tamarac client portal document vault. When enabled, your clients' document vault displays the same three Pershing folders available to you.
Now clients can securely access files from you and from Pershing in one place.
You can also take advantage of this integration by accessing clients' Pershing files within your document vault, without leaving the Tamarac platform.
For example, do you want to download a Household's tax files to share with a client's CPA? Since you're already in Tamarac, open the document vault, search for the Household, click the Pershing - Tax Documents folder, and you'll see all the Pershing tax files for that Household.
When using this integration, be aware that:
-
Pershing files are displayed for Households. If you search for a client in a Pershing folder, you will see the files for the Household that client belongs to.
-
You cannot add labels to Pershing files.
You must have the Pershing integration enabled to take advantage of the Pershing document vault integration. For more information, see Enrollment.
If you already have the Pershing integration enabled, you do not need to take any action. You will see the Pershing document vault folders automatically.
Services
Improved Support Management Dashboard
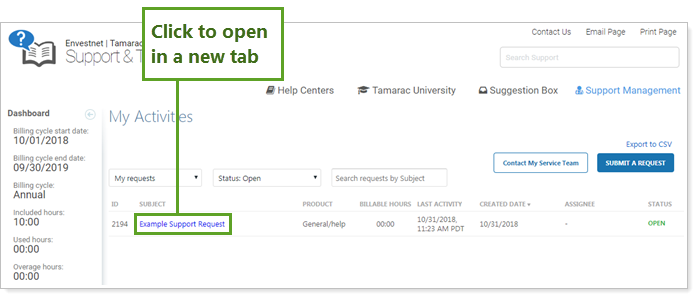
The Support Management dashboard is your hub for knowing what's happening when you've contacted us. The dashboard allows you to find support requests using filters and search terms. In the past, clicking a specific support request made you lose the filtering you put in place to find it.
With this release, we've streamlined this process. Now when you click the support ticket details link, the related messages open in a new browser tab. This saves you time by retaining your filters on the dashboard page for future use.
Learn More - Watch the Release Video