
Contents
Introduction
| Applies to: | |||
|---|---|---|---|
| ✔ Dynamic | Mobile | ✔ Client Portal | |
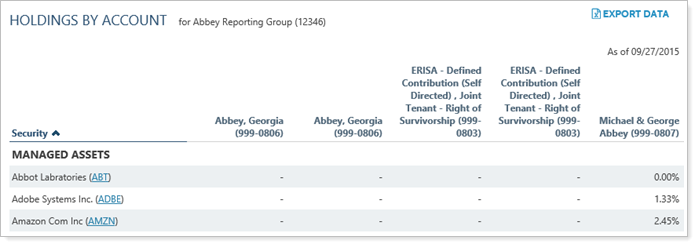
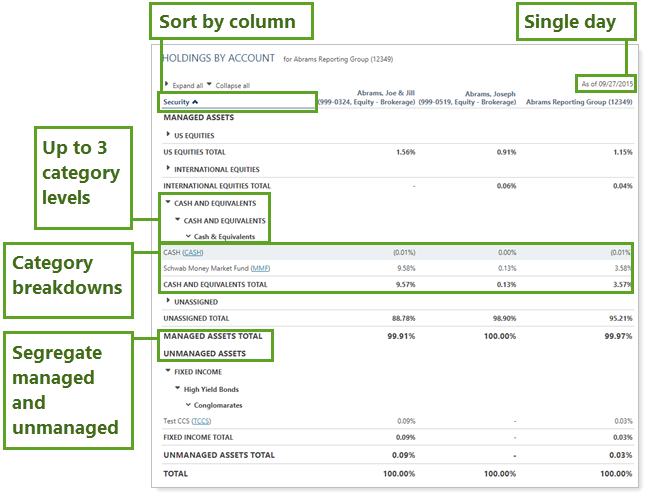
The Holdings by Account report displays a table of all the accounts in a group and either the weight or value of their holdings, including up to three different grouping levels. The report allows you to filter for specific securities, include only certain categories, and customize the display of SMAs and positions.
The Holdings by Account report is useful for seeing specifically which accounts in a group are holding which securities.
There is no limit to how many accounts you add to the report, but if the data exceeds 50,000 cells, it will be summarized. To see large amounts of data, use the Export data link at the top of the page to export the additional content to a CSV file.
Why Use the Holdings by Account Report?
In the Holdings by Account report, you will find detailed data reporting options that let you answer many holdings-related questions specifically about accounts within groups, such as:
-
Which Accounts in the Group Hold A Certain Security? Filter to see only specific security categories for all the accounts within a group.
-
What Weight or Value did a Specific Category or Asset Have on a certain day? Review a snapshot of all a group's total holdings, shown by account and sorted to your specifications, on a specific date.
-
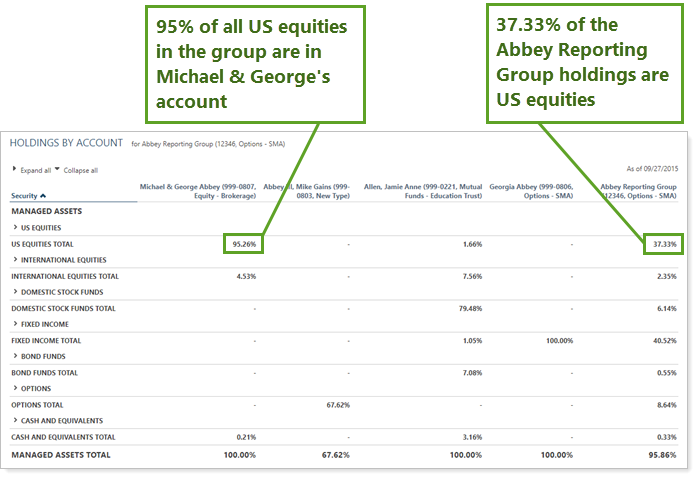
which accounts hold what percentage of each category in the portfolio? Easily see how categories are split among accounts within a group.
See the Holdings by Account Report in Action
An advisor wants to evaluate the equity holdings within a group. The advisor wants to evaluate how evenly equities are distributed across a group, but keeping in mind that some of the accounts are reserved for near-term financial goals that require less volatile holdings.
The Holdings by Account report grouped by asset class allows the advisor to see the equity holdings within the context of all the holdings in all the accounts in the group.
Features of the Holdings by Account Report
In the Holdings by Account report, you have granular control to help you easily identify and evaluate results. Interactive reporting features include the following.
Customize the Data and Display
Display only relevant data. You control what data are displayed and which columns are included, in what order, so you can create the exact report you need.
Filter the Report Data
Powerful filtering lets you see only relevant data points for the designated securities. Control how much detail you see—anything from each position held in all the accounts within a group, to a broad, group-wide holdings summary.
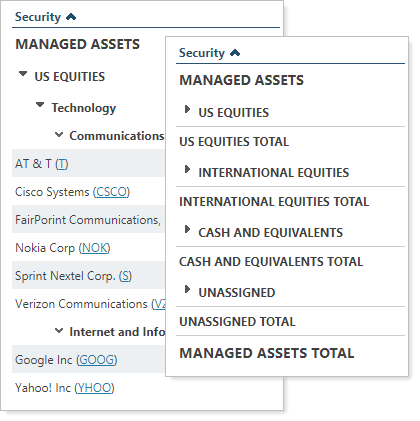
Expand or Collapse Rows
Expand (>) or collapse (˅) table rows to further control the level of detail.
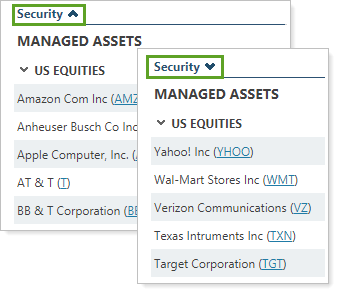
Sort Columns on the Fly
Sort columns by clicking column headers. The caret direction (^ or ˅) indicates sorting order, either ascending or descending.
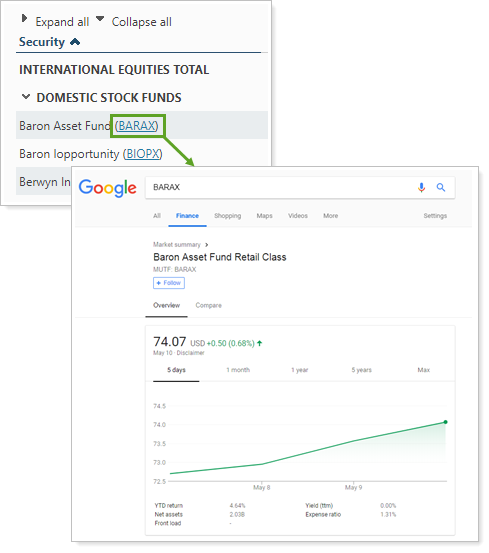
View Security Details
Click the name of a security to view Google Finance information about that security.
You can enable or disable ticker links for each security type.
Customize Naming
You can customize the name of most selected columns and the Managed/Unmanaged labels used for the headings and captions.
Add Holdings by Account to the Reporting Dashboard
There is no Holdings by Account dashboard widget available on the reporting dashboard.
Holdings by Account Report Settings
The following settings are available for the Holdings by Account report. Click the setting name for more details:
| Setting | Details | Available In... |
|---|---|---|
| Dynamic Report | ||
| Report Name | Designate a unique name for the report view. | X |
| Mark as Publicly Accessible | Share the report view. | X |
| As of Date | Select the date you want to use for the report. | X |
| Include Only | Filter the holdings displayed by category. | X |
| Group By/Then By |
Organize a report by various categories. |
X |
| Show Subtotals |
Add subtotals to each grouping level when you Group by. |
X |
| Unmanaged Asset Treatment |
Choose how you want to treat unmanaged assets on the report. For more information about marking securities as unmanaged and how reports display unmanaged assets, see: |
X |
| Show Values For |
Set a date period to use for performance calculations in the report. |
X |
| Show Position Detail |
Show or hide underlying positions that make up subtotals. |
X |
| Report SMAs as a Single Line Item | Choose how you want to see SMAs in the report. | X |
| Report Security Groups as Single Line Item | Choose how you want to see security groups in the report. | X |
Report Actions
To learn more about reports in Tamarac, see Introduction to Reports.
To learn more about how to generate a report, change the data displayed, print or export the report data, and more, see Basics of Working With Reports.
To learn more about creating and using PDF reports, see Understanding PDF Reports and Workflow: Generate a PDF Report.