Contents
Reporting
Add Charts to Net Worth PDF Reports
The chart on the dynamic Net Worth report shows at a glance how a client's financial situation changed over time. Now you can add this powerful and intuitive chart to your PDF reporting package with the new chart options on the Net Worth PDF full and dashboard sections.
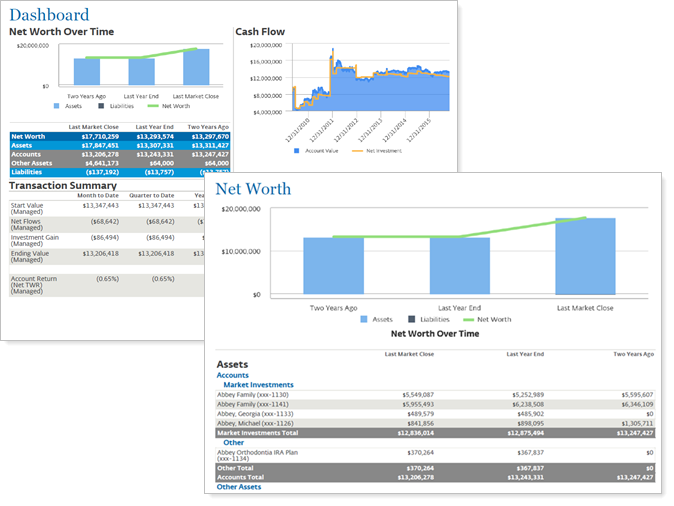
With this release, you can show the table, the chart, or both, creating a customized PDF report that's right for your clients. When you add the chart to a Net Worth PDF report section, you'll find all the configuration options you're used to from the dynamic report chart, including settings that let you show asset and liability bars, show the trend line, and control chart dates independently. We've also brought over a few other useful dynamic report settings, including showing subtotals at the bottom, sorting columns by value or alphabetically, and more.
By default, Net Worth PDF sections do not include a chart. Charts respect the existing PDF theme and site theme graph options.
When you add a Net Worth section to the PDF Dashboard, you'll find slightly simplified options appropriate for the situation.
For more information, see Net Worth Report.
Include Target Allocation Data Points on Holdings Reports
If you're like many advisors, you rely heavily on the Asset Allocation report for at-a-glance overviews of category weights and comparisons with model targets. With this release, you can combine the position-level Holdings report data with category-level target allocation data for an expanded, more robust Holdings report.
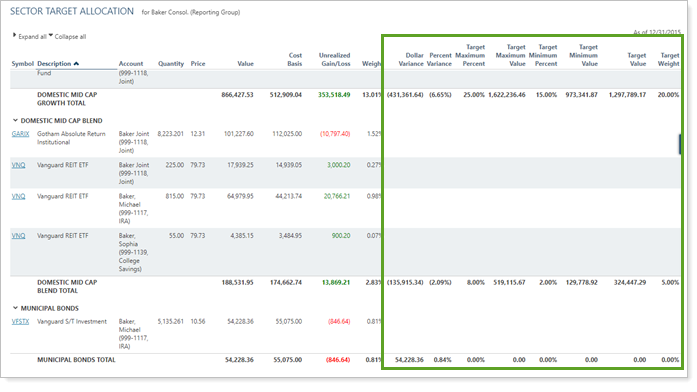
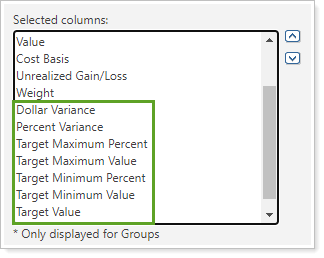
You can now add the following target allocation data points to the Holdings dynamic report, the client portal desktop and mobile app report, and the full PDF report:
- Dollar Variance
- Percent Variance
- Target Value
- Target Maximum Percent
- Target Minimum Percent
- Target Maximum Value
- Target Minimum Value
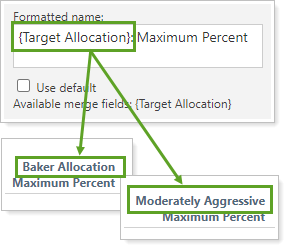
To identify which target allocation is assigned to the account or group, add the {Target Allocation} merge field to the column name. This field dynamically displays the name of the target allocation assigned.
For more information, see Add Target Allocation to the Holdings Report and Target Allocations.
Track Money Security Transactions With the Account Transaction Bulk Report
We know how important it is to track when money moves between money securities, especially between managed and unmanaged cash. You can use the Money Security option to turn the dynamic Transactions report into a cash ledger for just this kind of tracking. But sometimes you need to dig into even more details than the dynamic report can offer. That's why we've expanded this offering to bulk reports: so you can export money security data for as deep a cash flow analysis as you need.
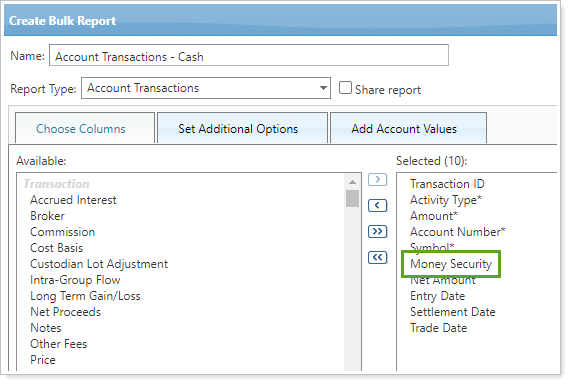
To track money securities in bulk, add the Money Security column to an Account Transactions bulk report. For more information, see Run a Bulk Report to Export Data in Bulk.
For more information about tracking cash, see See Cash Impacting Transactions.
Identify Partial Period Returns on the Account Analytics Report
The Account Analytics report shows results for all the data in a period, even if it's a partial period or the data was not available for some portion of the period. To help you identify returns for partial or linked periods, we've added the familiar partial period return indicators you're used to seeing on other performance reports.
The following symbols mark partial period returns on the Account Analytics Risk Measurements table:
- Dagger (†): Linked partial period (TWR only).
- Asterisk (*): All other partial period returns (TWR and IRR).

On the Account Analytics PDF report, partial period returns and linked returns are also represented with designations and footnotes that match the dynamic report.
Improved Consistency on the Account Ledger Report
In many PDF statements, you use the Account Ledger report to provide high-level overviews of values, returns, and account properties as an introduction to the more detailed reporting that follows. We've updated this important PDF-only report to ensure that it always matches the other reports it often serves to introduce.
More Intuitive Interval Flows Calculation for Same-Day, Same-Category Transactions
In the past, when transactions occurred within a security category, we would split the buys and sells when calculating the return. We attributed buys to the beginning of the day and sells to the end of the day. But this calculation method produced some unexpected returns when a majority of one category has high turnover in a single day.
To ensure that return numbers within categories make the most sense, we now consider buys and sells within a security category on the same day to happen simultaneously. This means that the flows associated with buy and sell transactions that occur on the same day are aggregated together. Then the net value is applied to the interval flow at either the beginning or the end of day.
Let's look at an example to see how this works.
Example
Category A starts at $100 and ends at $105. During the day, within Category A, the advisor buys $100 of Security ABC and sells $100 of Security XYZ.
Previously, the calculation would have looked like this:

Now, the calculation looks like this:

Note that this change only applies to category-level returns. Account level returns will remain the same.
See Accurate Quantities After Stock Splits When Using Intraday Pricing
Intraday pricing allows you to see up-to-date security prices within 15 minutes. However, intraday pricing does not include security quantity data. In some rare stock split situations, firms using this feature noticed that the Holdings report showed quantity data from the day before the split and price data from the current day.
With this release, we ensure that security quantities match the security value from the day of the split. If your firm uses intraday pricing, you will now see both prices and quantity on the Holdings report adjusted for stock splits on the day they occur.
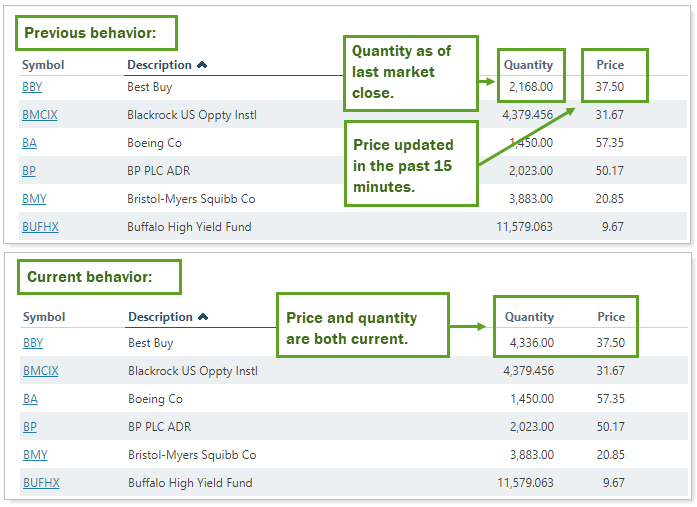
This adjustment occurs automatically. You do not need to take any additional action to enable this feature.
For more information, see Intraday Pricing.
Schedule Automatic Uploads via FTP Folder
For some applications, it is helpful to be able to regularly upload data sets to Tamarac. For example, your firm may source security details from a third party or use uploads to update Household and account data from a CRM. With this release, we streamline your process by allowing you to save a file to an FTP folder for automatic scheduled upload.
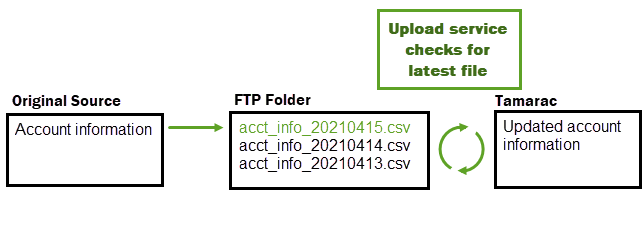
To schedule an automatic upload, work with your Tamarac Support team. You can choose the days, times, and frequency for uploads to fit your needs. Once configured, upload files by saving them to your FTP folder using a designated naming pattern.
For more information, see Schedule Recurring Custom Uploads.
For more information about using FTP folders, see Using And Connecting To The Tamarac FTP Site.
Integrations
See BNY Mellon | Pershing Realized Gain/Loss Data in Tamarac Reports
In some cases, such as after a cost basis reset, the custodian may be the most accurate source of realized gain/loss data. In these situations, your firm may want to source realized gain/loss information directly from the custodian for use in Tamarac reports. For firms using Tamarac Services, we now offer this option for accounts custodied at BNY Mellon and BNY Pershing in addition to our existing integrations.

To display realized gain/loss information from BNY Mellon and BNY Pershing data for accounts custodied there, select Use the Account Custodian As the Source of Record for Realized Gains Losses.
Security
Require Single Sign-On to Access Tamarac
Many firms use single sign-on (SSO) to provide increased security and make it easier to sign in to multiple platforms. With many employees working remotely, authentication and security have become more important than ever. This release, we give you the option to require users to sign into Tamarac products via your firm’s SSO, ensuring they only access Tamarac in the most secure way.
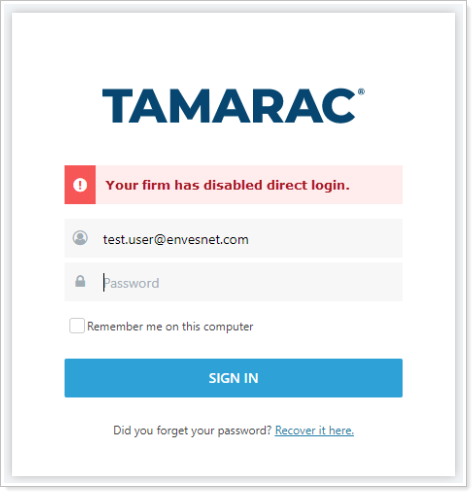
Depending on your firm’s needs, you can choose to require SSO for advisors, clients, or for both. When this option is enabled, users who attempt to sign in directly will see the following warning message:
Although SSO is not supported for the mobile app, requiring SSO will not prevent users from signing in to the mobile app. However, if you do not want users to be able to sign in to Tamarac using the mobile app, you can remove mobile app access.
To require SSO to access Tamarac or remove mobile app access, contact your Tamarac Support team.
For more information, see Require Single Sign-On to Access Tamarac Products.
Platform Improvements & Performance Enhancements
As part of our ongoing effort to improve speed and reliability on the Tamarac Platform, we are continuing to make enhancements under the hood. This table highlights improvements we made since our last release:
| Improvement Made | Type of Improvement |
|---|---|
|
We've automated some back-end data processing workflows and optimized processing for some of our internal tools so that now some of our internal servers are twice as fast as before. This means that not only do you get your data earlier in the day, but our teams can spend more time answering your questions, double-checking your data, and reconciling data. |
Code/Database |
|
Those of you trying out the beta version of the Rebalance page have probably noticed the incredible 43% decrease in page load time compared to the classic Rebalance page. |
Code/Database |
|
We sped up morning sync times by increasing the rebalancing engine throughput by 8.5%. |
Code/Database |
| We made some improvements focused on speeding up page load times for deeply nested account sets. | Code/Database |
Learn More - Watch the Release Video
